Blog

Full Stack System Call Latency Profiling

Finding the exact origin of a kernel-related latency can be very difficult: we usually end up recording too much or not enough information, and it becomes even more complex if the problem is sporadic or hard to reproduce.

In this blog post, we present a demo of a new feature to extract as much relevant information as possible around an unusual system call latency. Depending on the configuration, during a long system call, we can extract:

  • multiple kernel-space stacks of the process to identify where we are waiting,
  • the user-space stack to identify the origin of the system call,
  • an LTTng snapshot of the user and/or kernel-space trace to give some background information about what led us here and what was happening on the system at that exact moment.

All of this information is tracked at run-time with low overhead and recorded only when some pre-defined conditions are matched (PID, current state and latency threshold).

Combining all of this data gives us enough information to accurately determine where the system call was launched in an application, what it was waiting for in the kernel, and what system-wide events (kernel and/or user-space) could explain this unexpected latency.

Finding the Root Cause of a Web Request Latency

Comments

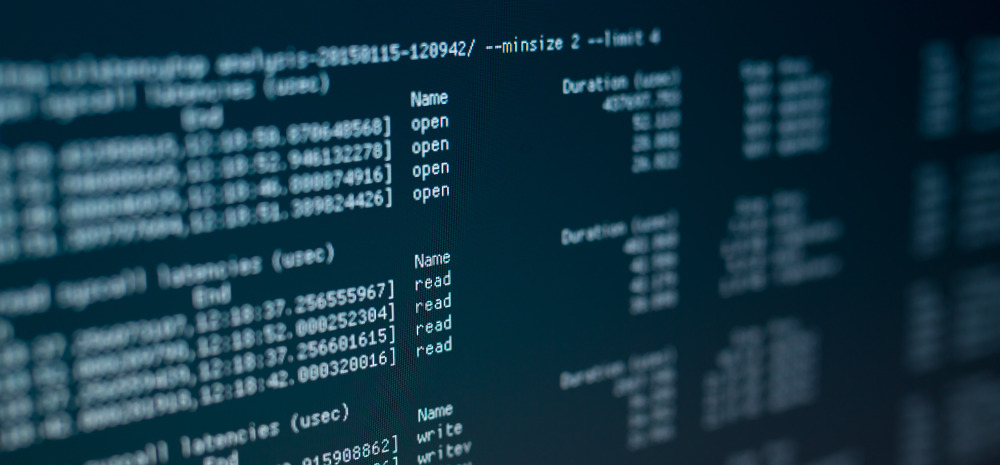
Photo: Copyright © Alexandre Claude, used with permission

When trying to solve complex performance issues, a kernel trace can be the last resort: capture everything and try to understand what is going on. With LTTng, that would go like that:

lttng create
lttng enable-event -k -a
lttng start
...wait for the problem to appear...
lttng stop
lttng destroy

Once this is done, depending on how long the capture is, there are probably a lot of events in the resulting trace (~50.000 events per second on my mostly idle laptop), now it is time to make sense of it !

This post is a first in a serie to present the LTTng analyses scripts. In this one, we will try to solve an unusual I/O latency issue.

Tracing Bare-Metal Systems: a Multi-Core Story

Comments

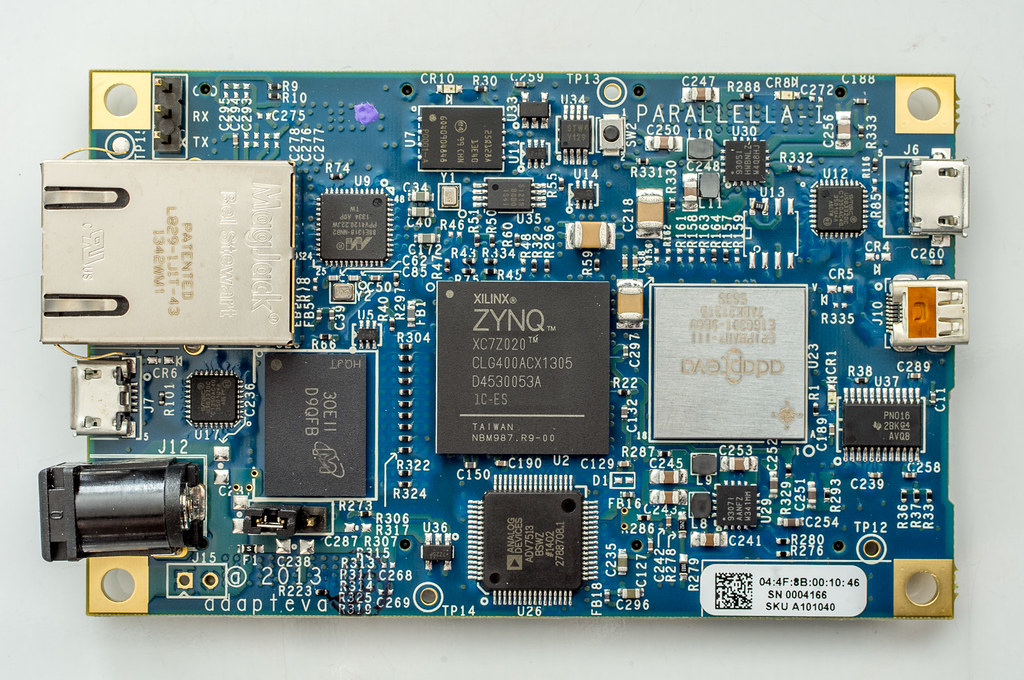
Photo: Copyright © Michael Kirschner, used with permission

Some systems do not have the luxury of running Linux. In fact, some systems have no operating system at all. In the embedded computing world, they are called bare-metal systems.

Bare-metal systems usually run a single application; think of microcontrollers, digital signal processors, or real-time dedicated units of any kind. It would be wrong, however, to assume that those application-specific applications are simple: they often are sophisticated little beasts. Hence the need to debug them, and of course, to trace them in order to highlight latency issues, especially since they're almost always required to meet strict real-time constraints.

Since Linux is not available on bare-metal systems, LTTng is unfortunately out of reach. LTTng's trace format, the Common Trace Format (CTF), is, however, still very relevant. Because CTF was designed with flexibility and write performance in mind, it's actually a well suited trace format for bare-metal environments.