Babeltrace 2: The command-line interface (CLI)
Back in the Montréal's cold winter of 2015, Jérémie Galarneau asked Philippe Proulx if he could lend a hand with adapting Babeltrace 1's TSDL-to-declarations visitor to a new TSDL-to-CTF IR visitor for an upcoming revision of the project (we weren't even sure we'd be bumping the major version at the time).
“Sure.” said Philippe.
This was five years ago and we just released Babeltrace 2 earlier this year.
The project's agenda mutated a lot during the past years. From a vague “new plugin-based trace converter with filters using the CTF writer API” to what we have now, many design ideas were actually coded and then abandoned in favor of better, often simpler and cleaner alternatives. Our awareness of Babeltrace 2's real goals also crystallized as time passed.
We won't say we're proud that Babeltrace 2 gestated for so long. But in every negative there's positive: we're proud of what we technically achieved and how it lays the groundwork for future features and even other EfficiOS projects.
Today's post is about Babeltrace 2's CLI, more precisely:
- The
runcommand is versatile and powerful, but not magic. - The
convertcommand is merely a special case of theruncommand. - The
convertcommand's stream intersection mode supports any source component class. - The
convertcommand automatically discovers source components.
Quick overview of Babeltrace 2's CLI
babeltrace2 is Babeltrace 2's command-line interface. It is
command-based, like
git and
lttng, where the first non-option argument can be a
command name.
There are five commands:
convert- Workhorse of the CLI with lots of dedicated options which strictly
performs a trace conversion job. This command is backward compatible
with
babeltrace, the CLI tool of Babeltrace 1. help- Prints the description and help text of a plugin and of its component classes.
list-plugins- Lists the available plugins and their component classes.
query- Performs a query operation on a component class and prints the results.
run- Creates and runs a trace processing graph for more complex trace processing tasks.
Make sure to have a look at
babeltrace-intro(7)
to learn more about the project and its core concepts.
The run command is versatile and
powerful, but not magic
With only the
--component,
--params,
and
--connect
options of the run
command, you can do a lot. This is because you use those options to
create a custom trace processing
graph
topology.
The three options above are position-dependent: --component
instantiates a component class as the current
component
and the following --params options, until the next --component,
append to its initialization parameters. So this creates three
components:
--component=ctf:source.ctf.fs --params='inputs=["my-trace"]' \
--component=muxer:filter.utils.muxer --component=pretty:sink.text.pretty
As you can see, initialization parameters are optional: the
filter.utils.muxer
and
sink.text.pretty
components do not require any.
You can place --connect options anywhere on the run command line to
specify connection
rules,
but they are still position-dependent between them. This is because of
how the connection rules work: if an output
port
does not match a given connection rule, then the run command tries the
next one. This means you can create fallbacks by putting more specific
connection rules first, for example:
--connect='ctf1.*sys23*:flt1' --connect='ctf2.*sys23*:flt2' --connect='ctf*:outg'
This connects:
- All the output ports of the
ctf1component containingsys23to theflt1component. - All the output ports of the
ctf2component containingsys23to theflt2component. - All the remaining output ports of any component starting with
ctfto theoutgcomponent.
You don't need to specify a single *: A:B is equivalent to
A.*:B.*, connecting any output port of component A to the first
available input port (by position) of component B.
With the run command, you must specifiy each component to create and
how they will be connected within the trace processing graph. In other
words, there's no magic: if the command cannot connect an output port,
it prints an error. If you need
message
muxing, you need to explicitly instantiate a filter.utils.muxer
component class and connect it. This strictness makes the run command
predictable and therefore more easy to debug.
A brief comparison with ffmpeg
ffmpeg and
ffplay are other tools which
create a processing graph from the command line (a media processing
graph in their case).
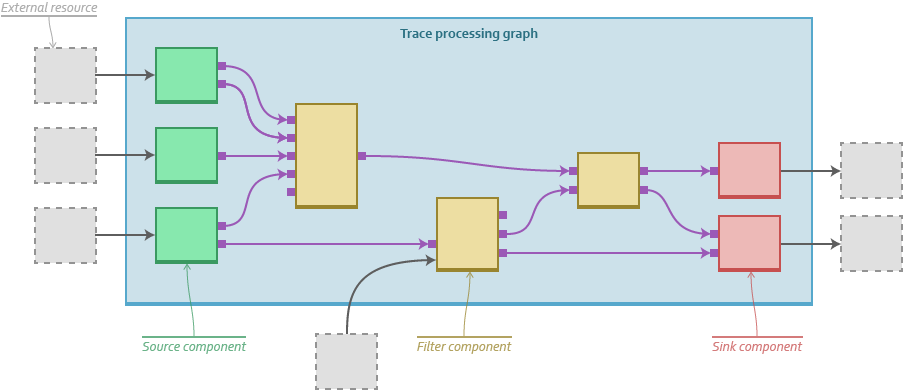
The FFmpeg to Babeltrace 2 concept mapping is:
- Filtergraph
- Trace processing graph
- Input "file"
- Source component
- Output "file"
- Sink component
- Filter
- Filter component
- Input and output pads
- Input and output ports
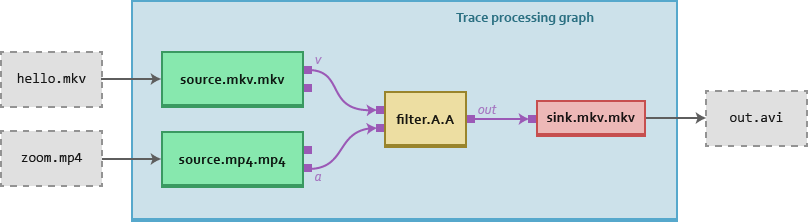
With ffmpeg, you specify the filters to use and how they form a
“filterchain” (how they are connected together) with the
-filter_complex option's argument, a single string which also sets the
initialization parameters for each filter. For example:
hello.mkv -i zoom.mp4 \
-filter_complex '[1:v][2:a]filterA=param1=23[out]' \
-map '[out]' out.avi
See the ffmpeg-filters(1) man page to explore the ffmpeg filter syntax.
The equivalent babeltrace2 run command line (using the short options)
would be something like:
-c hello:source.mkv.mkv -p inputs='["hello.mkv"]' \
-c zoom:source.mp4.mp4 -p inputs='["zoom.mp4"]' \
-c fa:filter.A.A -p param1=23 \
-c out:sink.avi.avi -p path=out.avi \
-x hello.video:fa.in0 -x zoom.audio:fa.in1 \
-x fa:out
While the babeltrace2 run command line is more verbose, we tend to prefer it
because:
-
It's more obvious what's instantiated and what's connected to what.
-
Each component has a unique name.
-
Initialization parameters are strongly typed, they are not just strings.
For example, with
-p param1=23, componentfareceives a map containing a signed integer entry (param1).
The convert command is merely a
special case of the run command
That's right: except for the stream
intersection feature
(--stream-intersection
option), everything you can do with the convert command,
you can also do with the run command.
In fact, internally, the convert
command
only cooks a run command line and then executes the run
command.
You can get a convert command line's equivalent run command line
with the
--run-args
option.
Here's an example:
$
babeltrace2 my-ctf-trace
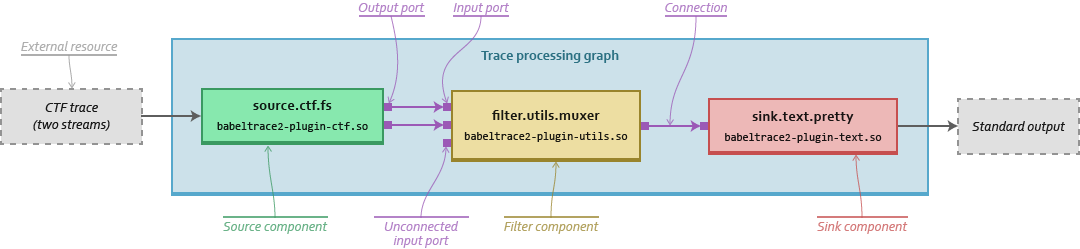
This very simple convert command line (convert is the default
command, so you don't need to specify it) converts a
CTF trace to a pretty, plain text form which
is the text format of Babeltrace 1's
babeltrace tool.
To achieve this conversion task, the command line above:
-
Instantiates a
source.ctf.fscomponent class to read a CTF trace located on the file system.Such a component creates one output port per data stream.
-
Instantiates a
filter.utils.muxercomponent class to mux (merge) the multiple CTF data stream messages into a single sequence of messages (multiple input ports to a single output port). -
Instantiates a
sink.text.prettyto pretty-print the consumed messages to the standard output. -
Connects the components above.
The equivalent run command line is:
$
babeltrace2 my-ctf-trace --run-args
--component auto-disc-source-ctf-fs:source.ctf.fs --params 'trace-name="my-ctf-trace"' \
--params 'inputs=["/path/to/my-ctf-trace"]' \
--component pretty:sink.text.pretty \
--component muxer:filter.utils.muxer \
--connect auto-disc-source-ctf-fs:muxer --connect muxer:pretty
In other words, you can pass those exact arguments to babeltrace2 run
and get the same results.
As you can see, the convert command automatically:
-
Finds which source component class to use for the
my-ctf-traceargument thanks to the automatic source component discovery feature.This is the
--component auto-disc-source-ctf-fs:source.ctf.fsand--params 'inputs=["/path/to/my-ctf-trace"]'parts. -
Adds a muxer filter component.
This is the
--component muxer:filter.utils.muxerpart. -
Adds the default pretty-printing sink component.
This is the
--component pretty:sink.text.prettypart. -
Sets the unique names of the components:
auto-disc-source-ctf-fs,muxer, andpretty. -
Connects all the output ports of the
source.ctf.fscomponent to the input ports of the muxer component (--connect auto-disc-source-ctf-fs:muxer) and the output port of the muxer component to the input port of the pretty-printing sink component (--connect muxer:pretty).
Let's try adding the
--debug-info
option to augment event messages with debugging information (when
available):
$
babeltrace2 my-ctf-trace --debug-info --run-args
--component auto-disc-source-ctf-fs:source.ctf.fs --params 'trace-name="my-ctf-trace"' \
--params 'inputs=["/path/to/my-ctf-trace"]' \
--component pretty:sink.text.pretty \
--component muxer:filter.utils.muxer \
--component debug-info:filter.lttng-utils.debug-info \
--connect auto-disc-source-ctf-fs:muxer --connect muxer:debug-info \
--connect debug-info:pretty
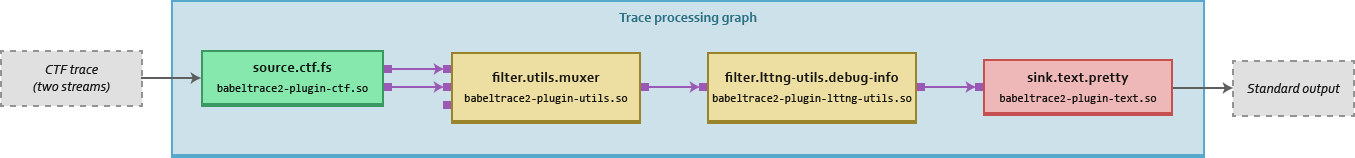
Using this option adds a
filter.lttng-utils.debug-info
component to the conversion chain (after the muxer component and before
the pretty-printing sink component).
Francis Deslauriers wrote most of the current
filter.lttng-utils.debug-info component class. Antoine
Busque introduced the debugging information
resolving code in Babeltrace 1 and we reused it for this component
class.
Let's use the
--debug-info-full-path
option instead to get absolute, instead of relative, source file paths
in debugging information fields:
$
babeltrace2 my-ctf-trace --debug-info-full-path --run-args
--component auto-disc-source-ctf-fs:source.ctf.fs --params 'trace-name="my-ctf-trace"' \
--params 'inputs=["/path/to/my-ctf-trace"]' \
--component pretty:sink.text.pretty \
--component muxer:filter.utils.muxer \
--component debug-info:filter.lttng-utils.debug-info --params full-path=yes \
--connect auto-disc-source-ctf-fs:muxer --connect muxer:debug-info \
--connect debug-info:pretty
The output is similar to the previous example, but now the debug-info
filter component is initialized with its
full-path
parameter set to true.
Finally, let's use another sink component instead of sink.text.pretty:
$
babeltrace2 my-ctf-trace --debug-info-full-path --component=sink.text.details --run-args
--component sink.text.details:sink.text.details \
--component auto-disc-source-ctf-fs:source.ctf.fs --params 'trace-name="my-ctf-trace"' \
--params 'inputs=["/path/to/my-ctf-trace"]' \
--component muxer:filter.utils.muxer \
--component debug-info:filter.lttng-utils.debug-info --params full-path=yes \
--connect auto-disc-source-ctf-fs:muxer \
--connect muxer:debug-info \
--connect 'debug-info:sink\.text\.details'

The convert command's
stream intersection mode supports any source component class
The convert command's
--stream-intersection
option enables the stream intersection mode.
The stream intersection mode makes the command discard, for a given trace, messages which occur outside the common time range of all the trace's streams.
Babeltrace 1's babeltrace
tool knows the CTF format specifically to
implement its stream intersection mode limiting the functionality to CTF
sources.
In Babeltrace 2, we designed the stream intersection mode so that it can
work with any source component class, not just source.ctf.fs. This is in part
possible due to the notion of query. Here's what happens behind the scenes:
-
For each source component to add, the
convertcommand queries thebabeltrace.trace-infosobject from its class.The parameters of this query operation are the exact same parameters that a source component of the same class would receive at initialization time. For example, for a
source.ctf.fscomponent class, the query operation parameters contain theinputsarray which contains the paths of the CTF traces to open.The results of this query operation contain, for each trace, the beginning and end times of each stream. How the queried source component class obtains those times exactly is implementation-defined. The
source.ctf.fscomponent class uses packet indexes, just like in Babeltrace 1.The results also contain, for each stream, the name of its dedicated output port, should a source component be created and initialized with the same parameters.
Here's a
babeltrace.trace-infosquery example,my-ctf-traceis a single trace made of four streams:$
babeltrace2 query source.ctf.fs babeltrace.trace-infos \
                  --params='inputs=["my-ctf-trace"]'
- stream-infos: - port-name: da82bf1c-bb28-4347-804d-dc8f26817aec | 0 | 0 range-ns: begin: 1509556764947050643 end: 1509557102182770973 - port-name: da82bf1c-bb28-4347-804d-dc8f26817aec | 0 | 1 range-ns: begin: 1509556764956409290 end: 1509557102182770490 - port-name: da82bf1c-bb28-4347-804d-dc8f26817aec | 0 | 2 range-ns: begin: 1509556764965620172 end: 1509557102182769632 - port-name: da82bf1c-bb28-4347-804d-dc8f26817aec | 0 | 3 range-ns: begin: 1509556764975082100 end: 1509557102181554525 -
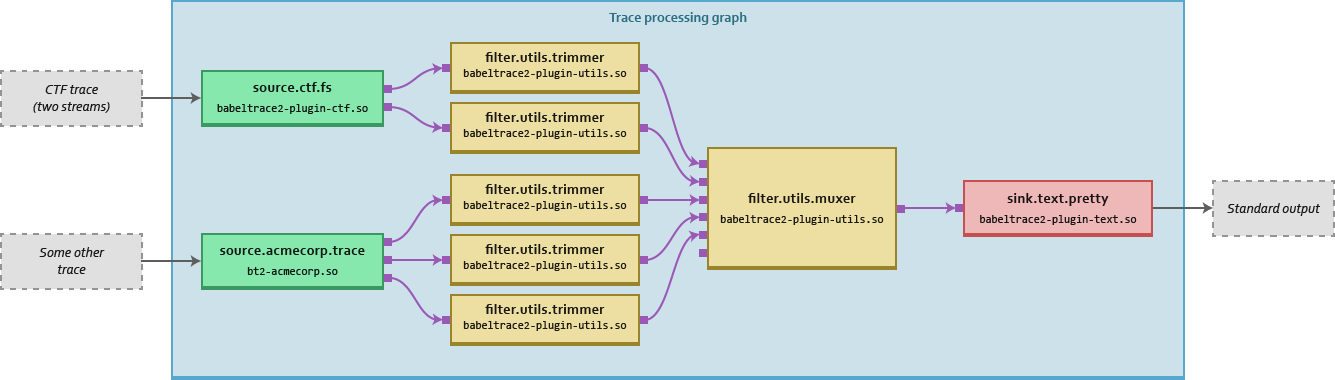
For each trace amongst all the source components, the command computes the time range of its stream intersection.
-
For each source component output port, the command inserts a
filter.utils.trimmercomponent with its time range set to the appropriate stream intersection time range.The command connects all trimmer filter components to a single
filter.utils.muxercomponent as usual.
Here's a command-line example and a diagram showing the resulting conversion graph:
$
babeltrace2 my-ctf-trace some-other-trace --stream-intersection
The convert command automatically
discovers source components
When you run
$
babeltrace /path/to/trace
the babeltrace command assumes that /path/to/trace is a path to a
CTF trace.
Because Babeltrace 2 is all about plugins offering many trace format encoders and decoders, we thought that this CTF-by-default strategy was a bit too selective.
For Babeltrace 2, Simon Marchi did a wonderful job
developing
an automatic source component
discovery
feature for both the CLI and the Python bindings (for
bt2.TraceCollectionMessageIterator).
babeltrace2's convert command uses this feature when you
pass any non-option argument, for example:
$
babeltrace2 /path/to/trace
Unlike the babeltrace CLI, babeltrace2 convert does not assume that
/path/to/trace is a CTF trace path. Instead, the convert command
loads all the
plugins
it can find, and for each source component class of a given plugin, it
queries its
babeltrace.support-info
object.
The babeltrace.support-info object contains a weight which represents
how much the queried source component class is confident that one of its
instances can handle the given input. A weight of zero means it cannot
handle the input.
The source.ctf.fs component class returns a non-zero weight when
it can find a metadata file in the given directory and perform other
quick CTF trace validations.
The convert command then chooses the source component class having the
greatest weight to handle the given input.
The automatic source component discovery system has other features which we won't detail here such as automatic directory recursion and input grouping.
New to Babeltrace 2, you can pass an LTTng live URL as a non-option argument for
the convert command to add a source.ctf.lttng-live component:
$
babeltrace2 net://somehost/host/target/session
This is possible because the source.ctf.lttng-live component class handles
babeltrace.support-info queries,
With the original babeltrace tool, you need to explicitly give the
LTTng live input format with -i lttng-live.
You can always use the
--run-args
option to see the
equivalent run command line:
$
babeltrace2 net://somehost/host/target/session --run-args
--component lttng-live:source.ctf.lttng-live \
--params 'inputs=["net://some-host/host/target/session"]' \
--params 'session-not-found-action="end"' \
--component pretty:sink.text.pretty \
--component muxer:filter.utils.muxer \
--connect lttng-live:muxer --connect muxer:pretty
To fully support the automatic source component discovery feature in the
babeltrace2 convert command, we had to stop using
popt and create our own little
argument
parser.
This is because you can use the
--params
and
--log-level
options after a non-option argument to append initialization parameters
and set the logging level of all the source components summoned by the
argument, for example:
$
babeltrace2 /path/to/trace --params=lorem=ipsum \
            /path/to/other-trace --params=factor=23.18 --log-level=INFO
popt, getopt(),
and the GLib command-line
parser
did not satisfy all our needs to support this and other command-line
parsing musts.
Conclusion
As the items of this post show, the Babeltrace 2 CLI is an important upgrade from its Babeltrace 1 counterpart for the end user, but also at the implementation level.
The babeltrace2 convert command offers options and features to
convert one or more traces to a given format without its user having to
understand many Babeltrace 2 trace processing graph concepts.
For example, you can set the convert command in stream intersection
mode, and not only for CTF inputs, with the --stream-intersection
mode.
The convert command can also automatically discover which component
classes to instantiate for one or more non-option arguments.
That being said, internally, the convert command strictly remains a
layer over run, the general-purpose trace processing graph building
and running command.
We want your feedback
We're always looking for more testers, and for more
people to read the documentation and try things out. The babeltrace-intro(7)
man page introduces the Babeltrace 2 concepts and parts. You can clone the
project’s repository and build it to get the man pages. If you want to share
feedback, please join us on the lttng-dev
mailing list or on OFTC’s #lttng IRC channel. We'd love to hear from you.