Tracing Bare-Metal Systems: a Multi-Core Story
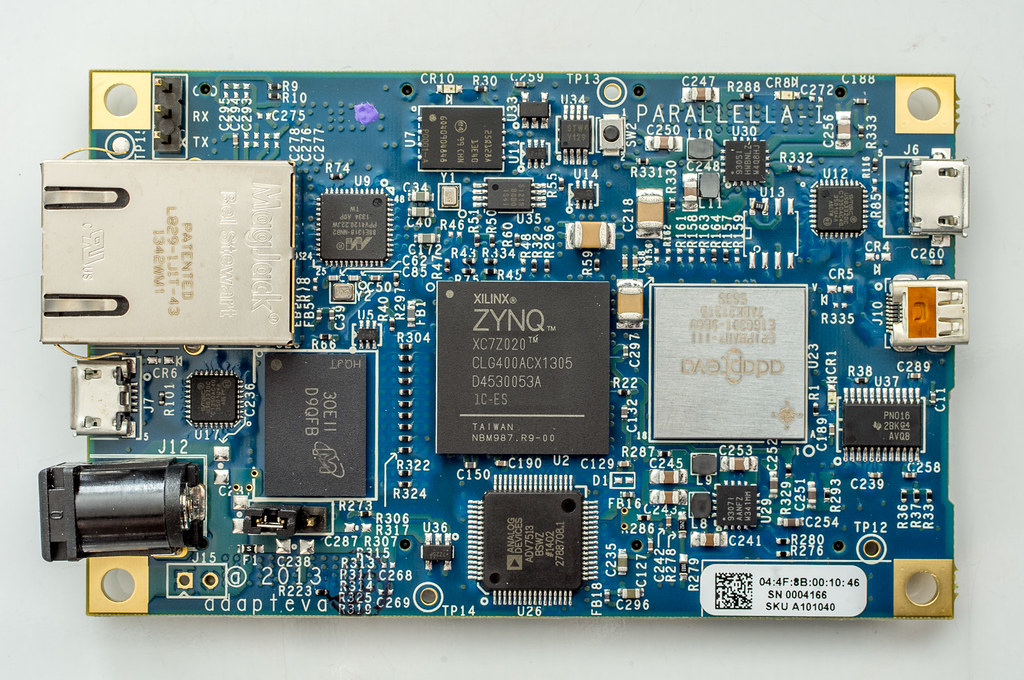
Photo: Copyright © Michael Kirschner, used with permission
Some systems do not have the luxury of running Linux. In fact, some systems have no operating system at all. In the embedded computing world, they are called bare-metal systems.
Bare-metal systems usually run a single application; think of microcontrollers, digital signal processors, or real-time dedicated units of any kind. It would be wrong, however, to assume that those application-specific applications are simple: they often are sophisticated little beasts. Hence the need to debug them, and of course, to trace them in order to highlight latency issues, especially since they're almost always required to meet strict real-time constraints.
Since Linux is not available on bare-metal systems, LTTng is unfortunately out of reach. LTTng's trace format, the Common Trace Format (CTF), is, however, still very relevant. Because CTF was designed with flexibility and write performance in mind, it's actually a well suited trace format for bare-metal environments.
CTF streams are made of binary packets containing concatenated recorded events. Each event consists of a header, usually containing its ID and timestamp, followed by optional contexts and payload fields.

CTF packet layout
Those fields may be anything, really: integers of any size, custom floating point numbers, NULL-terminated strings, enumerations, nested structures with named fields, static and dynamic arrays, or variants.
Now, how do CTF readers know the binary layout of CTF streams? An important, mandatory file accompanies the binary streams: the CTF metadata. This text file is a description of all the binary parts of CTF streams. CTF metadata is written in TSDL (Trace Stream Description Language), a domain-specific, C-like declarative language. Thanks to the metadata file, event names, field names, field and array sizes, and enumeration labels are not part of the actual binary trace, as it would be the case with, for example, BSON.
Even if writing plain CTF streams is somewhat easy, coding the appropriate functions to do so in C would become a repetitive task. Also, as a developer, manual CTF writing is error-prone. Thus, barectf was born.
barectf is a generator of C99-compatible code that can write native
binary CTF streams out of a CTF metadata file. barectf
is targetted at bare-metal systems: you provide your own packet buffer
of any size, as well as your own callbacks for instrumentation functions
to retrieve the current clock value, and then use the
generated barectf_trace_*() functions to instrument your embedded
application. The tracing functions—one per event—keep track of
a current bit position within the provided buffer (yes, bit, since
CTF integers and floating point numbers may be of any size in bits) and
return a specific error code if the event does not fit, in which case
the packet is ready to be closed and saved at some place using your own
buffering scheme. Currently, barectf supports all CTF types except
variants, albeit with specific constraints which are well defined in
the README.
To test this handy little tool on a bare-metal system, Christian Babeux and I spent some time studying the Adapteva Epiphany-III 16-core chip, a 16-core coprocessor running at 1 GHz. The Parallella board (shown above), which features the Epiphany-III 16-core, also has a Xilinx Zynq-7000 FPGA which serves two purposes: running Linux on the embedded ARM Cortex-A9 processor, as well as implementing the appropriate logic to communicate with the Epiphany cores. After looking into Adapteva's SDK and the Epiphany's technical reference manual, we wrote a simple example demonstrating how the 16 cores may natively produce correlated CTF streams using C code generated by barectf.
Here's the big picture:
- barectf generates instrumentation C code out of a hand-written CTF metadata file.
- Those generated C files are used by the device software to produce native CTF binary packets in buffers local to each Epiphany core.
- The host program is in charge of loading the device software, starting it, waiting a few seconds for the example to run, retrieving the CTF packets, and directly writing them to separate files on the host file system.
- The CTF binary stream files, as well as the original hand-written
CTF metadata, are used together by
babeltrace, a command-line CTF reader, to show the events (timestamps, names, field names and values) textually.
The following diagram shows those steps:
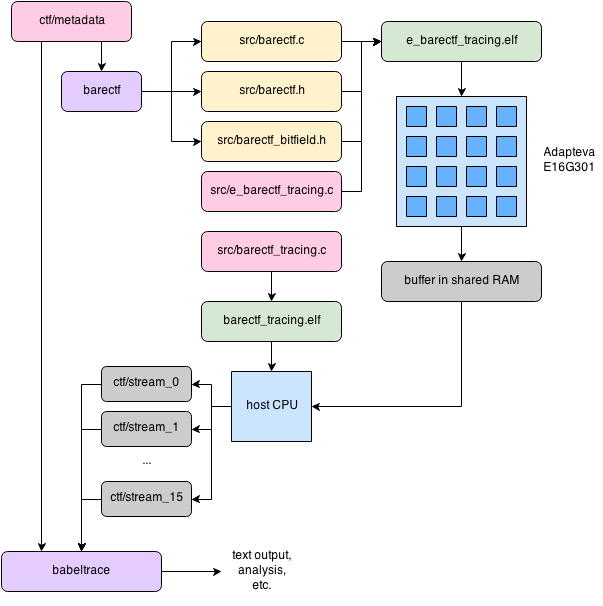
Example of barectf flow on the Adapteva Epiphany-III platform
The clock value is obtained from embedded hardware counters
(we used CTIMER1). Each core has two such counters. We used Epiphany
core's special instructions wand and idle together to make sure all
cores are synchronized before starting the counters. Combined with each
core writing CTF in local memory (before eventually copying it to
shared memory for the host to read it), this ensures all CTF streams
are correlated. This strong correlation is confirmed by the first
recorded event of each core:
[00:00:00.000007177] (+?.?????????) init: { row = 35, col = 9 }, { }
[00:00:00.000007177] (+0.000000000) init: { row = 34, col = 9 }, { }
[00:00:00.000007177] (+0.000000000) init: { row = 32, col = 8 }, { }
[00:00:00.000007177] (+0.000000000) init: { row = 33, col = 8 }, { }
[00:00:00.000007177] (+0.000000000) init: { row = 34, col = 10 }, { }
[00:00:00.000007177] (+0.000000000) init: { row = 32, col = 11 }, { }
[00:00:00.000007177] (+0.000000000) init: { row = 34, col = 8 }, { }
[00:00:00.000007177] (+0.000000000) init: { row = 33, col = 10 }, { }
[00:00:00.000007177] (+0.000000000) init: { row = 33, col = 11 }, { }
[00:00:00.000007177] (+0.000000000) init: { row = 32, col = 10 }, { }
[00:00:00.000007177] (+0.000000000) init: { row = 32, col = 9 }, { }
[00:00:00.000007177] (+0.000000000) init: { row = 35, col = 8 }, { }
[00:00:00.000007177] (+0.000000000) init: { row = 34, col = 11 }, { }
[00:00:00.000007177] (+0.000000000) init: { row = 35, col = 11 }, { }
[00:00:00.000007177] (+0.000000000) init: { row = 33, col = 9 }, { }
[00:00:00.000007177] (+0.000000000) init: { row = 35, col = 10 }, { }
...
The init event happens at the exact same clock tick on all 16 cores.
Each core then continues its execution, entering a loop in which
each iteration takes a certain time to complete, before hitting an
instrumentation function which adds a CTF event to the opened CTF
packet. This time is a function of the core's numeric ID, so that
different cores do not record events at the same clock tick. This is
also confirmed by babeltrace, e.g., the last event of the whole trace
was recorded by the core with the highest ID:
...
[00:00:00.002690434] (+0.000070272) epiphanious: { row = 35, col = 8 }, { sum = 496 }
[00:00:00.002691586] (+0.000001152) epiphanious: { row = 35, col = 9 }, { sum = 496 }
[00:00:00.002692738] (+0.000001152) epiphanious: { row = 35, col = 10 }, { sum = 496 }
[00:00:00.002693890] (+0.000001152) epiphanious: { row = 35, col = 11 }, { sum = 496 }
The example also demonstrates how CTF integers do not need to have a size that's a multiple of 8 bits, and how barectf allows this: a core's row and column are recorded as packed 6-bit integers in the stream packet context.
All in all, we are quite happy with the results of this experiment. Of course, there's room for improvement. For example, the counters (our CTF clocks) are not reset once they reach their maximum value. In real production use cases, we would need to handle the counter's overflow.
Regarding barectf, various optimizations could be added, and optionally, a function could be called instead of using a macro to record individual fields. It has also been suggested that a registered callback should be called whenever an event doesn't fit in the current CTF packet instead of the instrumentation function returning an error code; this would automate the buffering scheme (copying the buffer to some location and reopening it, or swapping buffers) outside the instrumentation call site, making barectf even easier to use.
We would like to extend our thanks to Adapteva for the sample Parallella board.