Blog

Monitoring real-time latencies

Comments

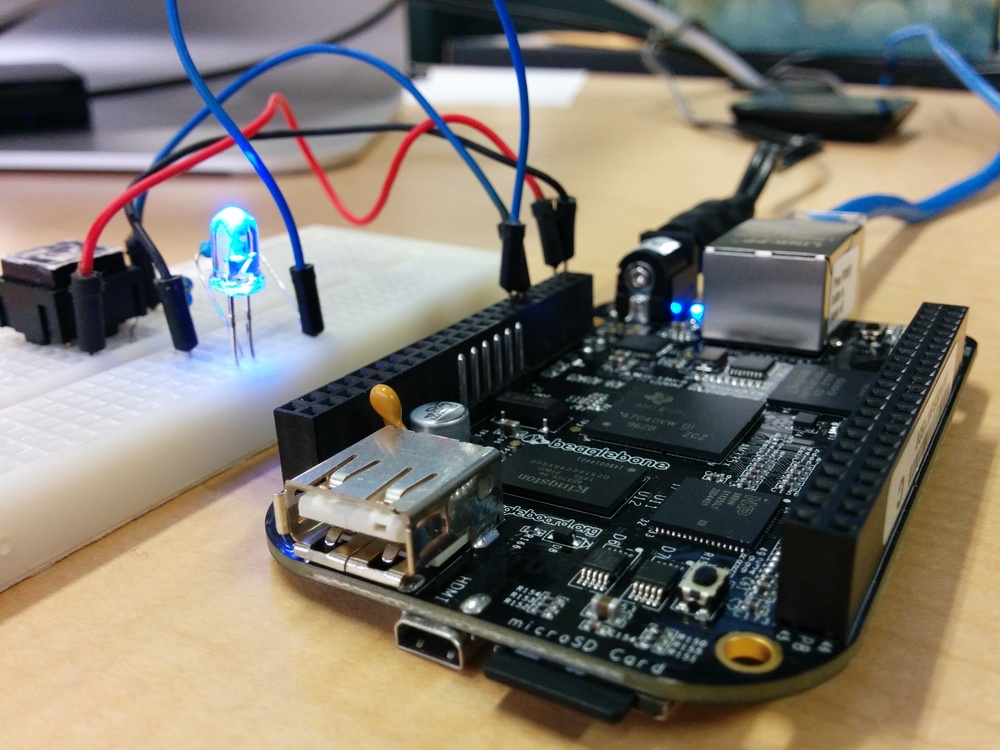
Photo: Copyright © Alexandre Claude, used with permission

Debugging and monitoring real-time latencies can be a difficult task: monitoring too much adds significant overhead and produces a lot of data, while monitoring only a subset of the interrupt handling process gives a hint but does not necessarily provide enough information to understand the whole problem.

In this post, I present a workflow based on tools we have developed to find the right balance between overhead and quickly identifying latency-related problems. To illustrate the kind of problems we want to solve, we use the JACK Audio Connection Kit sound server, capture relevant data only when it is needed, and then analyse the data to identify the source of a high latency.

The following tools are presented in this post:

Announcing the release of LTTng 2.7

Comments

We're happy to announce the release of LTTng 2.7 "Herbe à Détourne". Following on the coattails of a conservative 2.6 release, LTTng 2.7 introduces a number of long-requested features.

It is also our first release since we have started pouring considerable efforts into our Continuous Integration setup to test the complete toolchain on every build configuration and platform we support. We are not done yet, but we're getting there fast!

While we have always been diligent about robustness, we have, in the past, mostly relied on our users to report problems occurring on non-Intel platforms or under non-default build scenarios. Now, with this setup in place at EfficiOS, it has become very easy for us to ensure new features and fixes work reliably and can be deployed safely for most of our user base.

Testing tracers—especially kernel tracers—poses a number of interesting challenges which we'll cover in a follow-up post. For now, let's talk features!

barectf 2: Continuous Bare-Metal Tracing on the Parallella Board

Comments

My last post, Tracing Bare-Metal Systems: a Multi-Core Story, written back in November 2014, introduced a command-line tool named barectf which would output C functions that are able to produce native CTF binary streams out of a CTF metadata input.

Today, I am very happy to present barectf 2, a natural evolution of what could now be considered my first prototype. The most considerable feature of barectf 2 is its platform concept: prewritten C code for a specific target managing the opening and closing operations of packets, effectively allowing continuous tracing from the application's point of view.

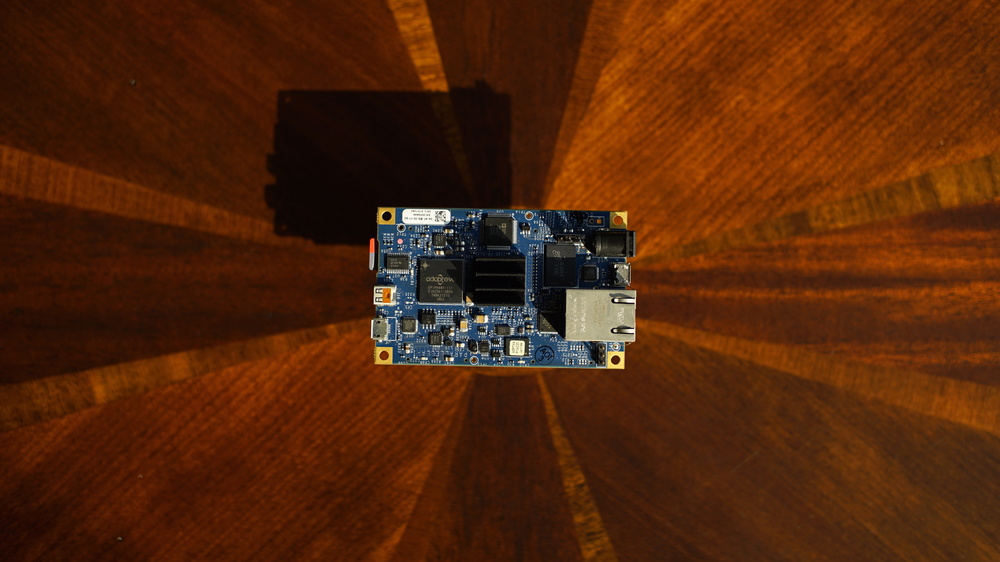
This post, like my previous one, explores the practical case of the Parallella board. This system presents a number of interesting challenges. To make a long story short, a bare-metal application being traced is running on the 16-core Epiphany, therefore producing a stream of packets, which must be extracted (or consumed) on the ARM (host) side.

Tutorial: Tracing Java Logging Frameworks

Comments

The LTTng-UST project is quite useful to instrument and trace C/C++ applications. In recent versions of the user space tracer, it is now possible to trace Java applications by leveraging existing Java logging frameworks. In practice, the messages logged by the framework will be rerouted to the user space tracer, hence a comprehensive view of the application stack and interaction with the rest of the system can be obtained. As of version 2.6, LTTng-UST supports two Java logging frameworks:

In this tutorial, we will see how to build LTTng-UST with the Java agent, how to instrument existing Java applications, and, finally, how to obtain traces resulting from the execution of those programs.

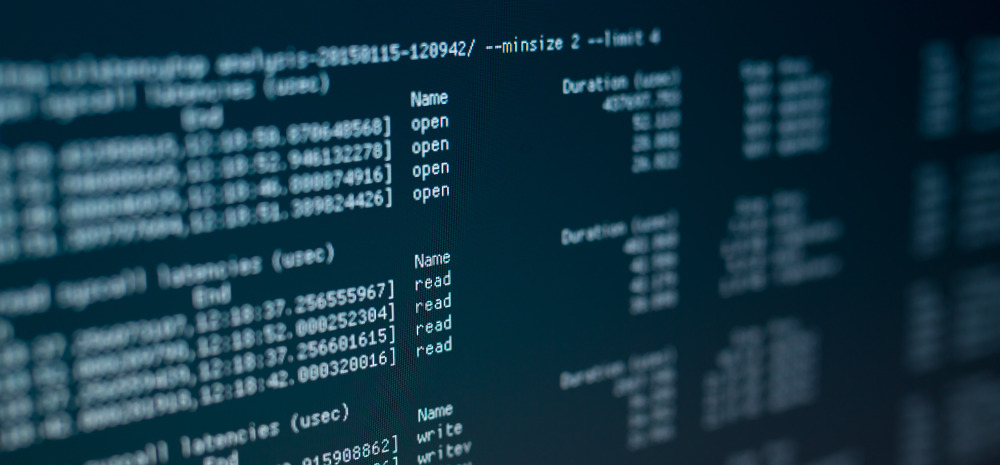
Full Stack System Call Latency Profiling

Finding the exact origin of a kernel-related latency can be very difficult: we usually end up recording too much or not enough information, and it becomes even more complex if the problem is sporadic or hard to reproduce.

In this blog post, we present a demo of a new feature to extract as much relevant information as possible around an unusual system call latency. Depending on the configuration, during a long system call, we can extract:

  • multiple kernel-space stacks of the process to identify where we are waiting,
  • the user-space stack to identify the origin of the system call,
  • an LTTng snapshot of the user and/or kernel-space trace to give some background information about what led us here and what was happening on the system at that exact moment.

All of this information is tracked at run-time with low overhead and recorded only when some pre-defined conditions are matched (PID, current state and latency threshold).

Combining all of this data gives us enough information to accurately determine where the system call was launched in an application, what it was waiting for in the kernel, and what system-wide events (kernel and/or user-space) could explain this unexpected latency.