Babeltrace 2 begins the project's new scope for tailor-made trace analyses

Babeltrace 2.0 will be our next release and it includes some major changes. We've realized that users need a simple way to work with traces, so we're expanding the project's scope to make that possible, and also to encourage sharing of tracing analysis tools. Starting with Babeltrace 2.0, the project will switch from a trace converter to a trace manipulation tool.
We're introducing a whole new architecture for Babeltrace based on the concept
of a filter graph. This new model
allows connecting components to build a modular trace analysis pipeline. Users
can share individual components in a pipeline to build on each other's work.
While this new architecture comes with a new set of APIs for libbabeltrace and
its Python bindings, the legacy Babeltrace 1 Python package, babeltrace, will
continue to exist and work for backward compatibility, while the
legacy libbabeltrace C API reaches the end of its life.
This isn't the first time we've added features to make it easier to work with traces: in 2012, we introduced Python bindings after it became clear that users needed a way to prototype using a high-level programming language. And the CTF (Common Trace Format) production library (CTF writer) was created in 2013 for perf to convert traces to CTF. But this is by far the most radical change ever made to the project. And it's one that we think will make it even better.
(This post expands on the talk (slides here) Jérémie Galarneau gave at the Tracing Summit 2017.)
Introducing processing graphs
We've moved to a pluggable graph model in Babeltrace 2. This makes it possible to assemble blocks of components to build custom trace analyses, and importantly, support more trace input and output formats.
Graphs are made up of sources (inputs), sinks (outputs), and filters (inputs/outputs). All of these pieces together are called components and they're instantiated from component classes which are provided by plugins. Components produce and consume notifications, to deal with actual event records. An important notification type is the trace event notification, but other types exist to accommodate various trace formats, for example packet beginning and end notifications.
Apart from needing a pluggable architecture, one crucial part of supporting out-of-tree plugins was missing in Babeltrace 1: a stable ABI. This is fixed in 2.0 and the plugin API will be frozen once the final release is done. This way, any out-of-tree plugin for proprietary trace formats (such as in-house hardware protocols) will be guaranteed to work as changes are made to the Babeltrace project. We hope this will encourage contributions for new trace formats and even useful filters.
Making it easier to work with traces
You can build a processing graph with the babeltrace command-line application
which loads plugins explicitly with the --component parameter or implicitly
with options like --debug-info and --clock-cycles. Babeltrace 2.0 will come
with a number of plugins that make it easier to work with traces. You can see
which plugins are available with the list-plugins command:
$
babeltrace list-plugins
From the following plugin paths:

  - /test/src/tools/babeltrace/plugins/ctf
  - /test/src/tools/babeltrace/plugins/text
  - /test/src/tools/babeltrace/plugins/utils
  - /test/src/tools/babeltrace/plugins/lttng-utils

Found 10 component classes in 4 plugins.

ctf:
  Path: /test/src/tools/babeltrace/plugins/ctf/babeltrace-plugin-ctf.la
  Description: CTF source and sink support
  Author: Julien Desfossez, Mathieu Desnoyers, Jérémie Galarneau, Philippe Proulx
  License: MIT
  Component classes:
    'source.ctf.lttng-live': Connect to an LTTng relay daemon and receive CTF streams.
    'sink.ctf.fs': Write CTF traces to the file system.
    'source.ctf.fs': Read CTF traces from the file system.

text:
  Path: /test/src/tools/babeltrace/plugins/text/babeltrace-plugin-text.la
  Description: Plain text component classes
  Author: Julien Desfossez, Mathieu Desnoyers, Philippe Proulx
  License: MIT
  Component classes:
    'source.text.dmesg': Read a dmesg output from a file or from standard input.
    'sink.text.pretty': Pretty-print notifications (`text` format of Babeltrace 1).

utils:
  Path: /test/src/tools/babeltrace/plugins/utils/babeltrace-plugin-utils.la
  Description: Graph utilities
  Author: Julien Desfossez, Jérémie Galarneau, Philippe Proulx
  License: MIT
  Component classes:
    'filter.utils.muxer': Sort notifications from multiple input ports to a single output port by time.
    'filter.utils.trimmer': Keep notifications that occur within a specific time range.
    'sink.utils.counter': Count notifications and print the results.
    'sink.utils.dummy': Consume notifications and discard them.

lttng-utils:
  Path: /test/src/tools/babeltrace/plugins/lttng-utils/babeltrace-plugin-lttng-utils.la
  Description: LTTng utilities
  Author: Julien Desfossez
  License: MIT
  Component classes:
    'filter.lttng-utils.debug-info': Augment compatible events with debugging information.
One new provided plugin, utils, offers the trimmer filter component class.
A trimmer component allows traces to be trimmed (handy when you're working
with very large trace data). Here's an example of how to build a graph that
trims a CTF trace named mytrace:
$
babeltrace mytrace --begin=22:14:38 --end=22:15:07 --output-format=ctf --output=new-mytrace
Behind the scenes, babeltrace instantiates a sink.utils.trimmer component
class to discard trace data outside the range described by the --begin and
--end arguments.
Babeltrace 2.0 comes with the ability to record an LTTng live trace on the file system, thanks to an LTTng live source and a CTF sink:
$
babeltrace --input-format=lttng-live net://localhost/my_host/my_session --output-format=ctf --output=/path/to/trace
This is not possible with Babeltrace 1: you can only use the lttng-live input
format with the text output format.
Of course, the real benefit comes from the ability to write plugins that work with whatever input/output format you're using.
A simple stack trace plugin example
You can write plugins using either the C API (with libbabeltrace) or the Python bindings, but the latter are the quickest way to prototype new components.
Here's an example of a stack trace sink component class written in Python that
consumes the lttng_ust_cyg_profile_fast:func_entry and
lttng_ust_cyg_profile_fast:func_exit events from the LTTng-UST function
tracing helper. You need to
compile your application with CFLAGS="-finstrument-functions -g" and preload
LTTng's “liblttng-ust-cygprofile-fast.so” shared library to trace these events,
which is explained in detail in the LTTng Documentation.
import bt2
import datetime
from termcolor import colored


@bt2.plugin_component_class
class stacktrace(bt2._UserSinkComponent):
    def __init__(self, params):
        self._indent = 0
        self._add_input_port('my_input_port')
        self._last_timestamp = None

    def _on_entry(self, notification):
        self._indent += 1
        self._print_time(notification)
        print(colored(notification.event['debug_info']['func'][:-2],
                      attrs=['bold']) + '() {')

    def _on_exit(self, notification):
        self._print_time(notification)
        print('}')
        self._indent -= 1

    def _print_time(self, notification):
        event = notification.event
        clock_class = list(notification.clock_class_priority_map)[0]
        timestamp_ns = event.clock_value(clock_class).ns_from_epoch
        if self._last_timestamp is None:
            time_ui = str(datetime.datetime.fromtimestamp(
                event.clock_value(clock_class).ns_from_epoch / 1E9))
        else:
            delta = timestamp_ns - self._last_timestamp
            time_ui = '+{} ns'.format(delta)
            time_ui = '{:>26}'.format(time_ui)
            if delta >= 2000:
                time_ui = colored(time_ui, 'red', attrs=['bold'])

        print(time_ui + '  ' * self._indent, end='')
        self._last_timestamp = timestamp_ns

    def _port_connected(self, port, other_port):
        self._iterator = port.connection.create_notification_iterator(
            [bt2.EventNotification])
        return True

    def _consume(self):
        notification = next(self._iterator)
        if notification.event.name == 'lttng_ust_cyg_profile_fast:func_entry':
            self._on_entry(notification)
        elif notification.event.name == 'lttng_ust_cyg_profile_fast:func_exit':
            self._on_exit(notification)


bt2.register_plugin(__name__, 'demo')
The most important parts of the plugin are the _consume() and _on_entry()
methods. The first processes the next event and the second extracts the
function name from the application's debugging information. The rest of the
code is for pretty-printing the stack trace.
Base classes are provided in the Python bindings for source, filter, and sink components. Inheriting one of them fills out boilerplate code, which means it's quick and easy to begin writing a custom plugin.
The register_plugin() function takes a couple of mandatory parameters that
specify the module and plugin names.
Before you use this plugin, you need to generate trace data that the example
plugin can convert. You can use LTTng to set up a tracing session, and record
function entry and exit events for a utility like ls(1). For example:
Create a tracing session:
$
lttng create my-session
Create an event rule to enable all user space events:
$
lttng enable-event --userspace --all
Add instruction pointer and process ID context fields to the default user space channel:
$
lttng add-context --userspace --type ip --type vpid
Start tracing:
$
lttng start
Launch `ls(1)` with debugging information enabled:
$
LD_PRELOAD=liblttng-ust-cyg-profile-fast.so ls
Stop and destroy the tracing session:
$
lttng stop
$
lttng destroy
With the trace data available, you're now ready to try out the demo plugin.
The --plugin-path parameter for the babeltrace tool is required so
that the example plugin can be found, and the --component argument
instantiates one sink.demo.stacktrace component within the
conversion graph. Since debugging information is required for the
stack trace component to resolve addresses to symbol names, you
also need the --debug-info parameter, which inserts the
filter.lttng-utils.debug-info plugin into the conversion graph.
Philippe please insert graph diagram
$
babeltrace--plugin-path=/path/to/plugin --debug-info --component=sink.demo.stacktrace /tmp/path/to/trace
The following screenshot shows the kind of output you will see.
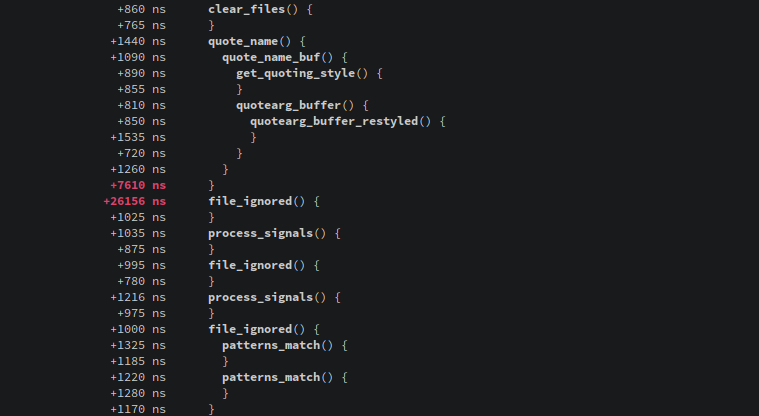
Screenshot of demo plugin
Another useful view for this plugin (and arguably one that is more
typical for stack trace tools) would be to print the time spent in a
given function on a given stack level. But this the demo plugin is
just an example to show how the simple APIs in Babeltrace 2 make it
easy to perform useful trace analysis.
We want your feedback
A lot has changed from Babeltrace 1 to Babeltrace 2. We believe the changes provide more flexibility for analyzing trace data and a small, sensible API for writing new plugins. However, we could use community feedback to ensure that these changes best address everyone's needs before we freeze the API. And while the project is now feature complete, we're working on performance improvements which could impact the C and Python APIs.
To this end, we're looking for more testers, and for more people to read the documentation and try things out. The babeltrace-intro(7) man page introduces the Babeltrace 2 concepts and parts. You can clone the project’s repository and build it to get the man pages.
If you want to weigh in on the design or share feedback, please join us on the lttng-dev mailing list or on OFTC’s #lttng IRC channel. We'd love to hear from you.