Discover and try out LTTng projects under development.
LTTng Scope 0.4
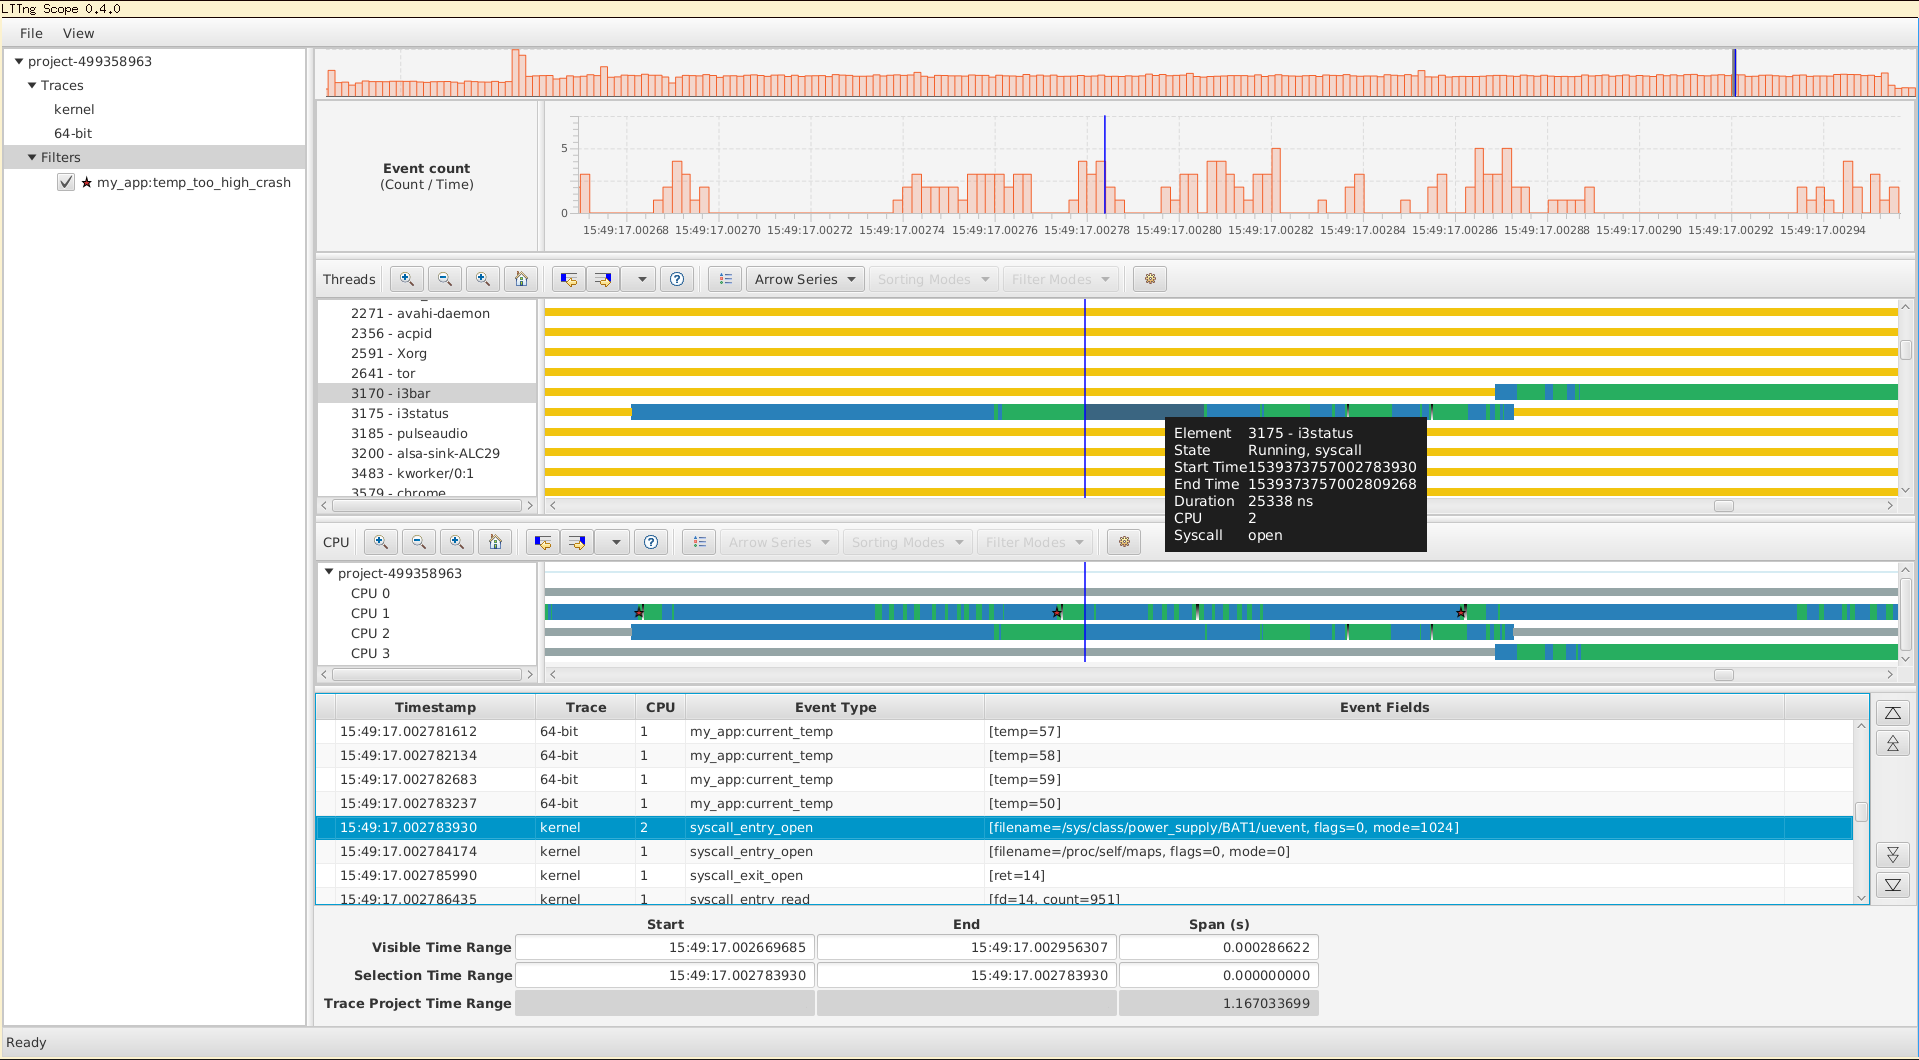
LTTng Scope is an experimental graphical viewer for LTTng kernel and user space traces for Linux, Windows, and macOS. With this new project, we want to experiment with UI/UX and determine how users can efficiently interact with traces using a graphical user interface.
Have a look at our LTTng Scope 0.3: A basic tutorial blog post for a quickstart with LTTng Scope.
Please note that LTTng Scope 0.4 is definitely not ready for use in production. We are making it available to get it "out there" and to gather valuable user feedback.
Some currently available features include:
- Project-wide event highlighting (filter) shown in all views.
- Thread and CPU execution state visualization.
- Detailed event record list.
- Timestamp formatting, interoperable with Babeltrace.
- Streamlined workflow.
- Convenient installer.
There are some obvious limitations during the initial development phase of this project:
- Hard-coded set of views specific to LTTng kernel traces.
- You can only open one trace.
We are planning to release new preview versions over the next few months as we introduce changes, new features, and performance improvements.
Do not hesitate to report any issue you encounter and give us feedback!
lttng/lttng-scope
Blog post: LTTng Scope 0.3: A basic tutorial
LTTng Scope 0.4 installer for Linux
LTTng Scope 0.4 installer for Windows
LTTng Scope 0.4 installer for macOS