LTTng Scope 0.3: A basic tutorial
Since we released the first public version of LTTng Scope, our new experimental graphical trace viewer, I thought it would be nice to do a quick tutorial on how to get started using it.
We'll go trough collecting a Linux kernel trace with LTTng, opening it in LTTng Scope, and then use a simple filter to pinpoint some events.
Step 1: Get a trace
First, we need a trace to open. If you don't want to setup LTTng, you can download one that we generated here and skip to Step 2. Otherwise, follow this quick guide on how to install LTTng and collect a similar trace on an Ubuntu 16.04 cloud instance.
Login to the cloud instance as the default ubuntu user and install the
LTTng packages using the
LTTng Stable 2.10 PPA.
For more details, or to install LTTng on another platform, have a look
at the LTTng Documentation.
$
$
$
$
sudo apt-add-repository ppa:lttng/stable-2.10
sudo apt update
sudo apt install lttng-modules-dkms lttng-tools python3-lttnganalyses
sudo adduser ubuntu tracing
Then, logout and log back in for the new tracing group membership to
be effective. We're now ready to
create our tracing session.
Let's name it my-test-trace and
create a single channel
with an 8 MiB sub-buffer size:
$
$
lttng create my-test-trace
lttng enable-channel --kernel --subbuf-size=8M chan1
Now, create
a selection of useful event rules for the Linux kernel tracing domain
within our my-test-trace tracing session:
$
$
$
$
$
$
$
$
$
$
$
$
$
$
$
$
$
$
$
$
$
$
$
$
$
$
$
$
$
$
$
lttng enable-event --session=my-test-trace --kernel --channel=chan1 sched_switch
lttng enable-event --session=my-test-trace --kernel --channel=chan1 sched_wakeup
lttng enable-event --session=my-test-trace --kernel --channel=chan1 sched_waking
lttng enable-event --session=my-test-trace --kernel --channel=chan1 block_rq_complete
lttng enable-event --session=my-test-trace --kernel --channel=chan1 block_rq_issue
lttng enable-event --session=my-test-trace --kernel --channel=chan1 block_bio_remap
lttng enable-event --session=my-test-trace --kernel --channel=chan1 block_bio_backmerge
lttng enable-event --session=my-test-trace --kernel --channel=chan1 netif_receive_skb
lttng enable-event --session=my-test-trace --kernel --channel=chan1 net_dev_xmit
lttng enable-event --session=my-test-trace --kernel --channel=chan1 sched_process_fork
lttng enable-event --session=my-test-trace --kernel --channel=chan1 sched_process_exec
lttng enable-event --session=my-test-trace --kernel --channel=chan1 lttng_statedump_process_state
lttng enable-event --session=my-test-trace --kernel --channel=chan1 lttng_statedump_file_descriptor
lttng enable-event --session=my-test-trace --kernel --channel=chan1 lttng_statedump_block_device
lttng enable-event --session=my-test-trace --kernel --channel=chan1 mm_vmscan_wakeup_kswapd
lttng enable-event --session=my-test-trace --kernel --channel=chan1 mm_page_free
lttng enable-event --session=my-test-trace --kernel --channel=chan1 mm_page_alloc
lttng enable-event --session=my-test-trace --kernel --channel=chan1 block_dirty_buffer
lttng enable-event --session=my-test-trace --kernel --channel=chan1 irq_handler_entry
lttng enable-event --session=my-test-trace --kernel --channel=chan1 irq_handler_exit
lttng enable-event --session=my-test-trace --kernel --channel=chan1 softirq_entry
lttng enable-event --session=my-test-trace --kernel --channel=chan1 softirq_exit
lttng enable-event --session=my-test-trace --kernel --channel=chan1 softirq_raise
lttng enable-event --session=my-test-trace --kernel --channel=chan1 irq_softirq_entry
lttng enable-event --session=my-test-trace --kernel --channel=chan1 irq_softirq_exit
lttng enable-event --session=my-test-trace --kernel --channel=chan1 irq_softirq_raise
lttng enable-event --session=my-test-trace --kernel --channel=chan1 kmem_mm_page_alloc
lttng enable-event --session=my-test-trace --kernel --channel=chan1 kmem_mm_page_free
lttng enable-event --session=my-test-trace --kernel --channel=chan1 writeback_pages_written
lttng enable-event --session=my-test-trace --kernel --channel=chan1 lttng_logger
lttng enable-event --session=my-test-trace --kernel --channel=chan1 --syscall --all
The tracing session is now ready to be started, but we still need some
form of workload to generate interesting events for the trace. Let's
use a simple workload.sh script that will do just that:
#!/bin/sh

echo 'Send 2 ping request to google.com' > /proc/lttng-logger
ping -c 2 google.com

echo 'Create a temporary directory' > /proc/lttng-logger
WORKDIR="$(mktemp -d)"

echo 'Enter temporary directory' > /proc/lttng-logger
cd "$WORKDIR" || exit 1

echo 'Download the lttng.org front page' > /proc/lttng-logger
wget http://lttng.org -O index.html

echo 'Grep for `linux` in the downloaded html file'
grep -i linux ./index.html

echo 'Sleep for 2 seconds' > /proc/lttng-logger
sleep 2

echo 'Create a 2 MiB random file' > /proc/lttng-logger
dd if=/dev/urandom of=./random bs=1024k count=2

echo 'Compress the random file with gzip' > /proc/lttng-logger
gzip -9 ./random

echo 'Download the `tree` source tarball' > /proc/lttng-logger
wget http://mama.indstate.edu/users/ice/tree/src/tree-1.7.0.tgz

echo 'Extract the tarball' > /proc/lttng-logger
tar xf tree-1.7.0.tgz

echo 'Enter the source directory' > /proc/lttng-logger
cd tree-1.7.0

echo 'Build with `make -j4`' > /proc/lttng-logger
make -j4

echo 'Delete the temporary directory' > /proc/lttng-logger
rm -rf "$WORKDIR"
Finally, start the tracing session, run the workload, and destroy the tracing session:
$
$
$
lttng start
sh workload.sh
lttng destroy
The resulting trace can be found in the ~/lttng-traces directory. Its
name starts with the tracing session name we chose (my-test-trace)
and also contains a timestamp corresponding to the start time.
$
ls -lh ~/lttng-traces
drwxrwx--- 3 ubuntu ubuntu 4.0K Mar 19 15:52 my-test-trace-20180319-155210
Let's see if it contains useful data by running an analysis script:
$
lttng-iousagetop ~/lttng-traces/my-test-trace-20180319-155210/
Checking the trace for lost events...
Processing the trace: 100% [################################################################################################] Time: 0:00:06
Timerange: [2018-03-19 15:52:22.040807606, 2018-03-19 15:52:26.835301271]
Per-process I/O Read                                                                        Process                   Disk       Net        Unknown
################################################################################
████████████████████████████████████████████████████████████████████████████████   2.00 MiB dd (14480)                  2.00 MiB      0   B      0   B
███████████████████████████████████████████████████████████████████████████████    2.00 MiB gzip (14481)                2.00 MiB      0   B      0   B
████████████████████████████████████████████████████████████                       1.52 MiB collect2 (14509)            1.52 MiB      0   B      0   B
███████████████████████████████                                                  814.06 KiB cc1 (14490)               814.06 KiB      0   B      0   B
██████████████████████████████                                                   794.79 KiB cc1 (14503)               794.79 KiB      0   B      0   B
██████████████████████████████                                                   792.86 KiB cc1 (14491)               792.86 KiB      0   B      0   B
██████████████████████████████                                                   788.09 KiB cc1 (14496)               788.09 KiB      0   B      0   B
██████████████████████████████                                                   787.61 KiB cc1 (14492)               787.61 KiB      0   B      0   B
██████████████████████████████                                                   786.27 KiB cc1 (14493)               786.27 KiB      0   B      0   B
██████████████████████████████                                                   781.97 KiB cc1 (14499)               781.97 KiB      0   B      0   B

Per-process I/O Write                                                                       Process                   Disk       Net        Unknown
################################################################################
████████████████████████████████████████████████████████████████████████████████   2.00 MiB gzip (14481)                2.00 MiB      0   B      0   B
███████████████████████████████████████████████████████████████████████████████    2.00 MiB dd (14480)                  2.00 MiB      0   B     92   B
████████                                                                         209.05 KiB cc1 (14490)               209.05 KiB      0   B      0   B
███████                                                                          180.00 KiB gzip (14484)                   0   B      0   B 180.00 KiB
██████                                                                           162.89 KiB tar (14483)               162.89 KiB      0   B      0   B
█████                                                                            131.27 KiB collect2 (14509)          131.27 KiB      0   B      0   B
███                                                                               99.48 KiB gcc (14505)                99.48 KiB      0   B      0   B
███                                                                               77.36 KiB cc1 (14491)                77.36 KiB      0   B      0   B
██                                                                                72.18 KiB cc1 (14503)                72.18 KiB      0   B      0   B
██                                                                                56.79 KiB cc1 (14496)                56.79 KiB      0   B      0   B

Per-file I/O Read                                                                           Path
################################################################################
████████████████████████████████████████████████████████████████████████████████   2.00 MiB /dev/urandom
███████████████████████████████████████████████████████████████████████████████    2.00 MiB ./random
███████████████████████████████████████████████████                                1.29 MiB /usr/lib/gcc/x86_64-linux-gnu/5/include/stddef.h
█████████████████████████                                                        658.79 KiB /usr/include/wchar.h
███████████████████                                                              491.47 KiB tree
███████████                                                                      287.79 KiB /usr/include/unistd.h
██████████                                                                       277.74 KiB /usr/include/time.h
████████                                                                         230.28 KiB /usr/include/stdlib.h
████████                                                                         214.41 KiB /usr/include/stdio.h
████████                                                                         209.05 KiB /tmp/ccAA9npj.s

Per-file I/O Write                                                                          Path
################################################################################
████████████████████████████████████████████████████████████████████████████████   2.00 MiB ./random.gz
███████████████████████████████████████████████████████████████████████████████    2.00 MiB ./random
████████                                                                         209.05 KiB /tmp/ccAA9npj.s
███████                                                                          180.00 KiB unknown (gzip)
█████                                                                            131.27 KiB tree
███                                                                               99.48 KiB tree.o
███                                                                               77.36 KiB /tmp/ccMZ0m6j.s
██                                                                                72.18 KiB /tmp/ccu470Vz.s
██                                                                                56.79 KiB /tmp/ccd7D0Dq.s
██                                                                                55.34 KiB /tmp/ccXWCQUj.s

Block I/O Write                                                                             Process
################################################################################
████████████████████████████████████████████████████████████████████████████████ 424.00 KiB lttng-consumerd (pid=12032)
████████████████████████████████████████                                         212.00 KiB cc1 (pid=14490)
█████████████████                                                                 92.00 KiB jbd2/vda1-8 (pid=318)
███████████████                                                                   80.00 KiB cc1 (pid=14491)
██████████████                                                                    76.00 KiB cc1 (pid=14503)
███████████                                                                       60.00 KiB cc1 (pid=14496)
██████████                                                                        56.00 KiB cc1 (pid=14492)
█████████                                                                         52.00 KiB cc1 (pid=14493)
████                                                                              24.00 KiB cc1 (pid=14499)
                                                                                   4.00 KiB kworker/0:1H (pid=376)

Disk Requests Sector Count                                                                    Disk
################################################################################
████████████████████████████████████████████████████████████████████████████████ 2176 sectors vda1

Disk Request Count                                                                            Disk
################################################################################
████████████████████████████████████████████████████████████████████████████████ 117 requests vda1

Disk Request Average Latency                                                             Disk
################################################################################
████████████████████████████████████████████████████████████████████████████████ 0.21 ms vda1

Network Received Bytes                                                                 Interface
################################################################################
                                                                                 0   B ens3

Network Sent Bytes                                                                         Interface
################################################################################
████████████████████████████████████████████████████████████████████████████████ 14.13 KiB ens3
Great, we're done! Let's now create an archive of the trace and copy it back to our workstation:
$
$
cd ~/lttng-traces
tar -czf my-test-trace.tar.gz my-test-trace-*
Step 2: Install LTTng Scope
Grab the latest LTTng Scope installer for your platform in the files section. LTTng Scope is available for Linux, Windows, and macOS.
Step 3: Open the trace in LTTng Scope
Before we can open the trace, we need to extract it from its archive. On most platforms, you can use the native tools to do it. On Windows, I recommend that you install 7-Zip, but most file archivers will work.
Launch LTTng Scope from your application menu. You should be greeted with this screen after a couple seconds:
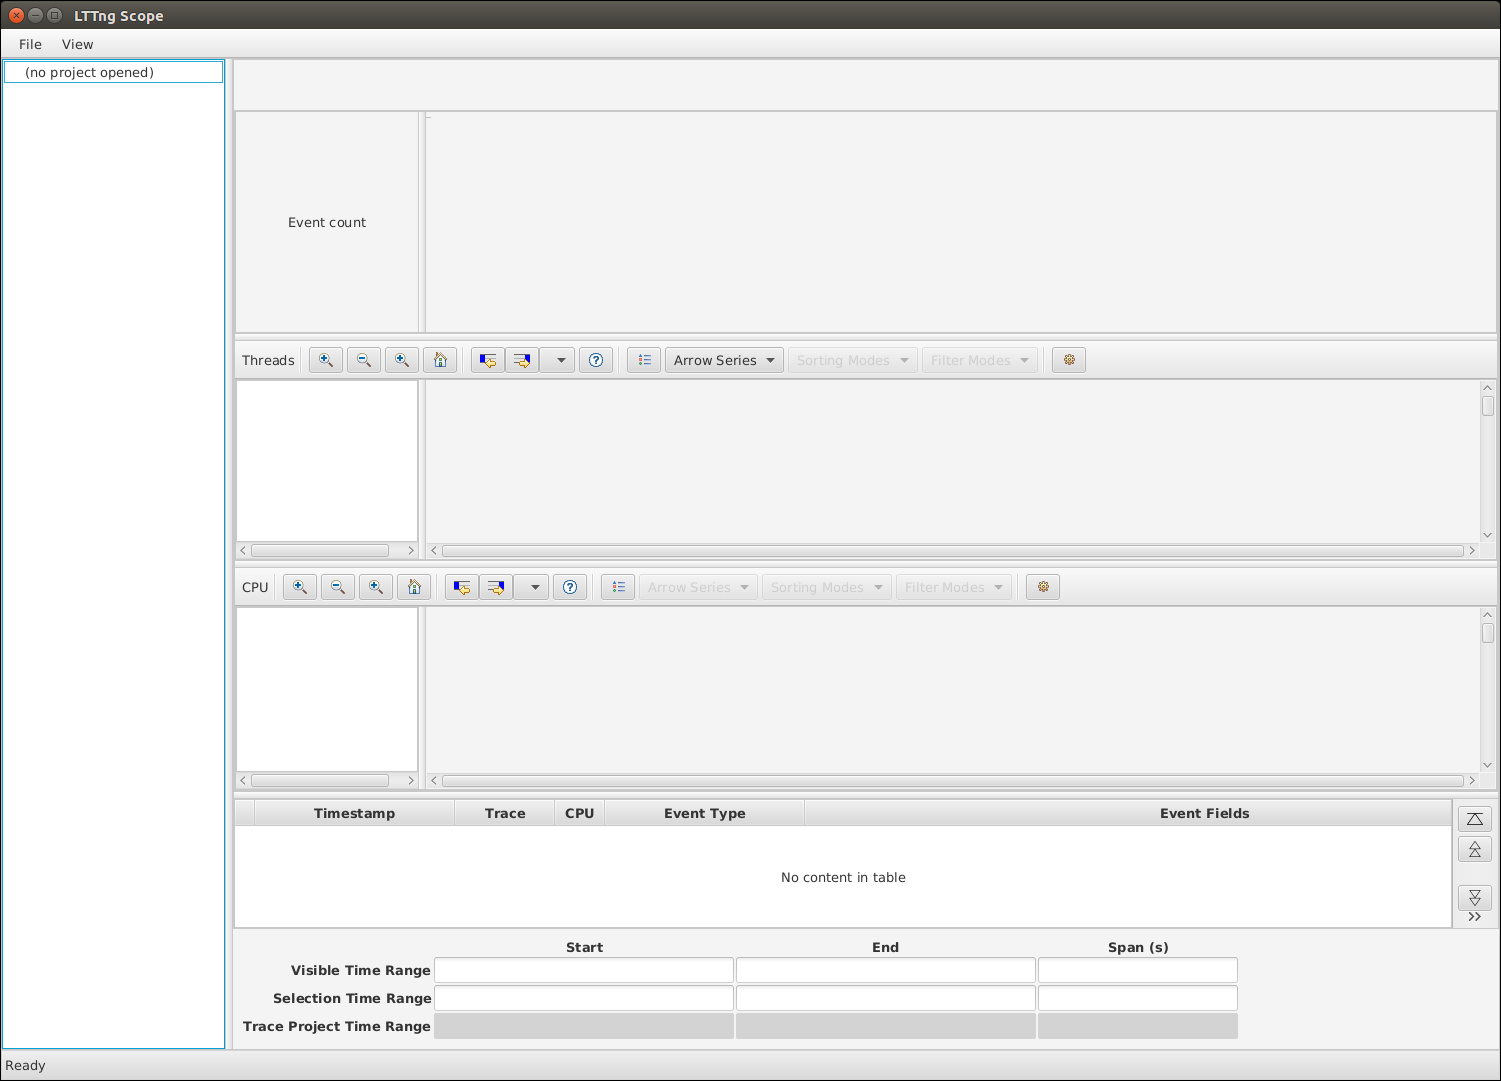
LTTng Scope main window
Let's open our trace:
- Click the File menu, then click Open….
- Navigate to the directory where you extracted the trace archive. You
need to enter the main trace directory and then the
kernelsubdirectory where you see themetadatafile. - Without selecting any specific file, click Open.
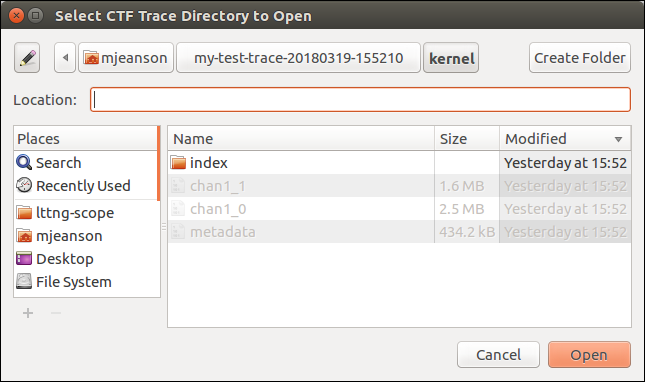
LTTng Scope's trace opening dialog
The initial view after opening a trace is zoomed in on the first 100 ms of the trace. Let's get an overall view:
- Put your mouse cursor over any of Event count, Threads, or CPU view.
- Hold the Ctrl key and scroll down with your mouse wheel until the views stop changing.
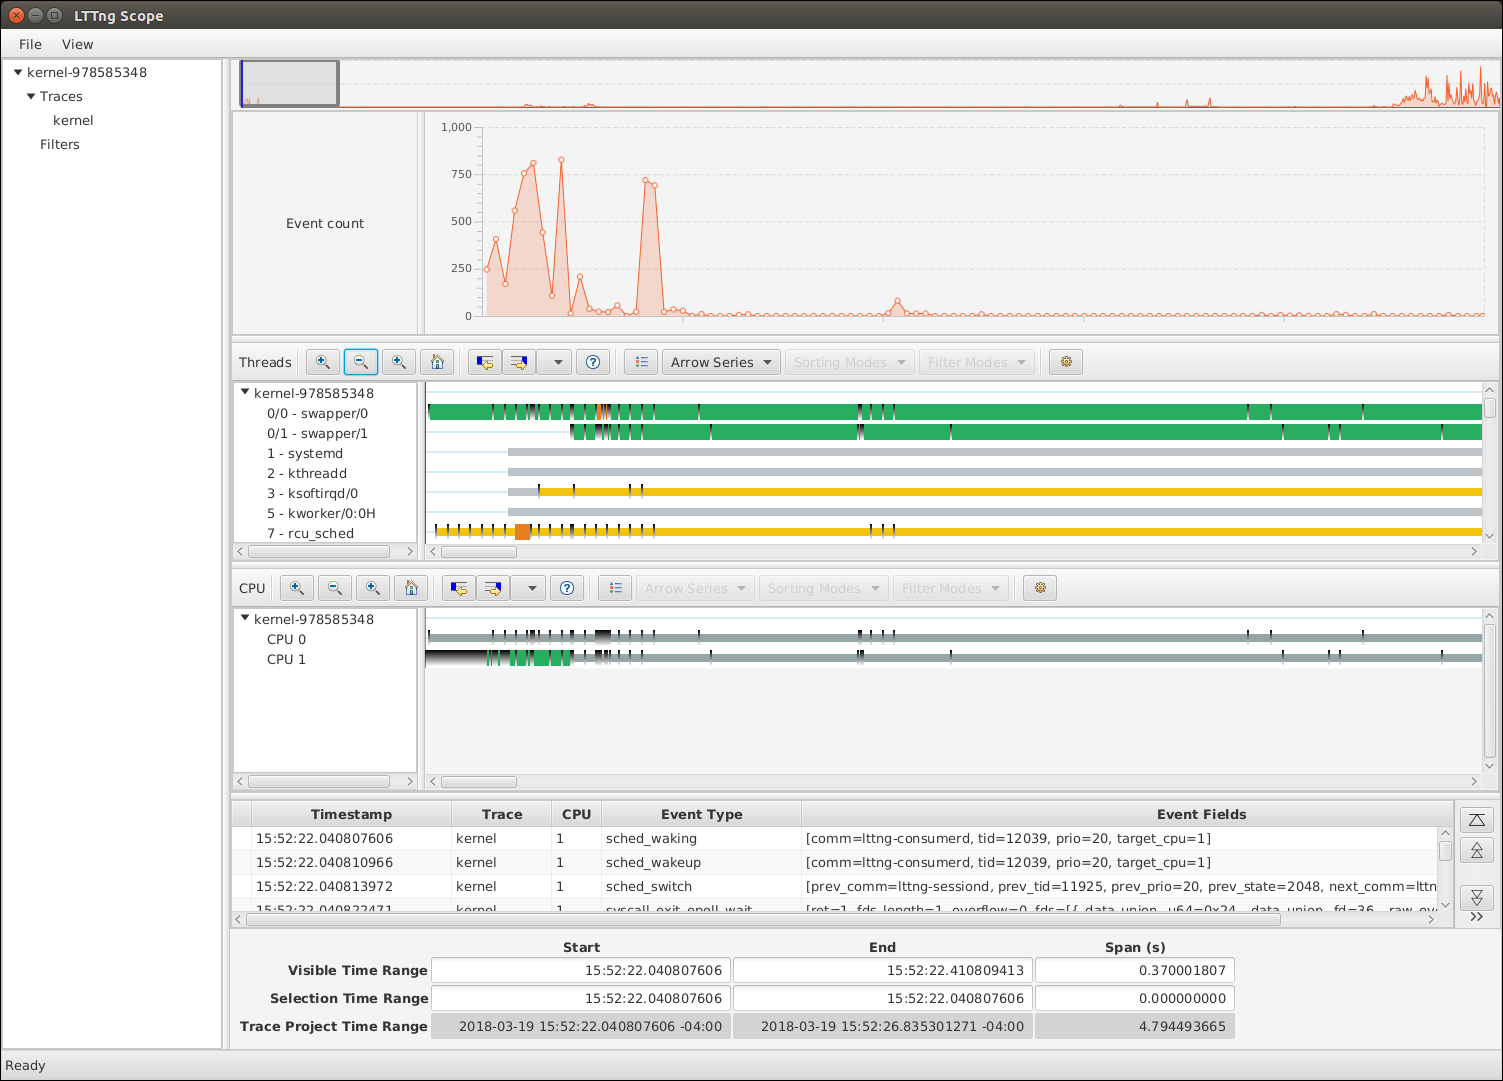
LTTng Scope's initial view
We now have a complete overview of the trace, but we can't easily pinpoint interesting events from here.

LTTng Scope's zoomed out view
Let's add a filter to identify points of interest in the trace.
We'll use the lttng_logger events that we emitted from the workload.sh
script before each action.
To create the filter:
- Right click Filters in the left tree view.
- Click Create Filter….
- Enter your chosen event name, and select a color and a shape for the filter markers.
- Click OK.
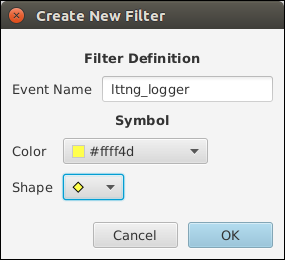
LTTng Scope's filter creation dialog
We can now see each of the lttng_logger events in the CPU view.
Those can help you navigate the trace and identify important events.
LTTng Scope with an active filter
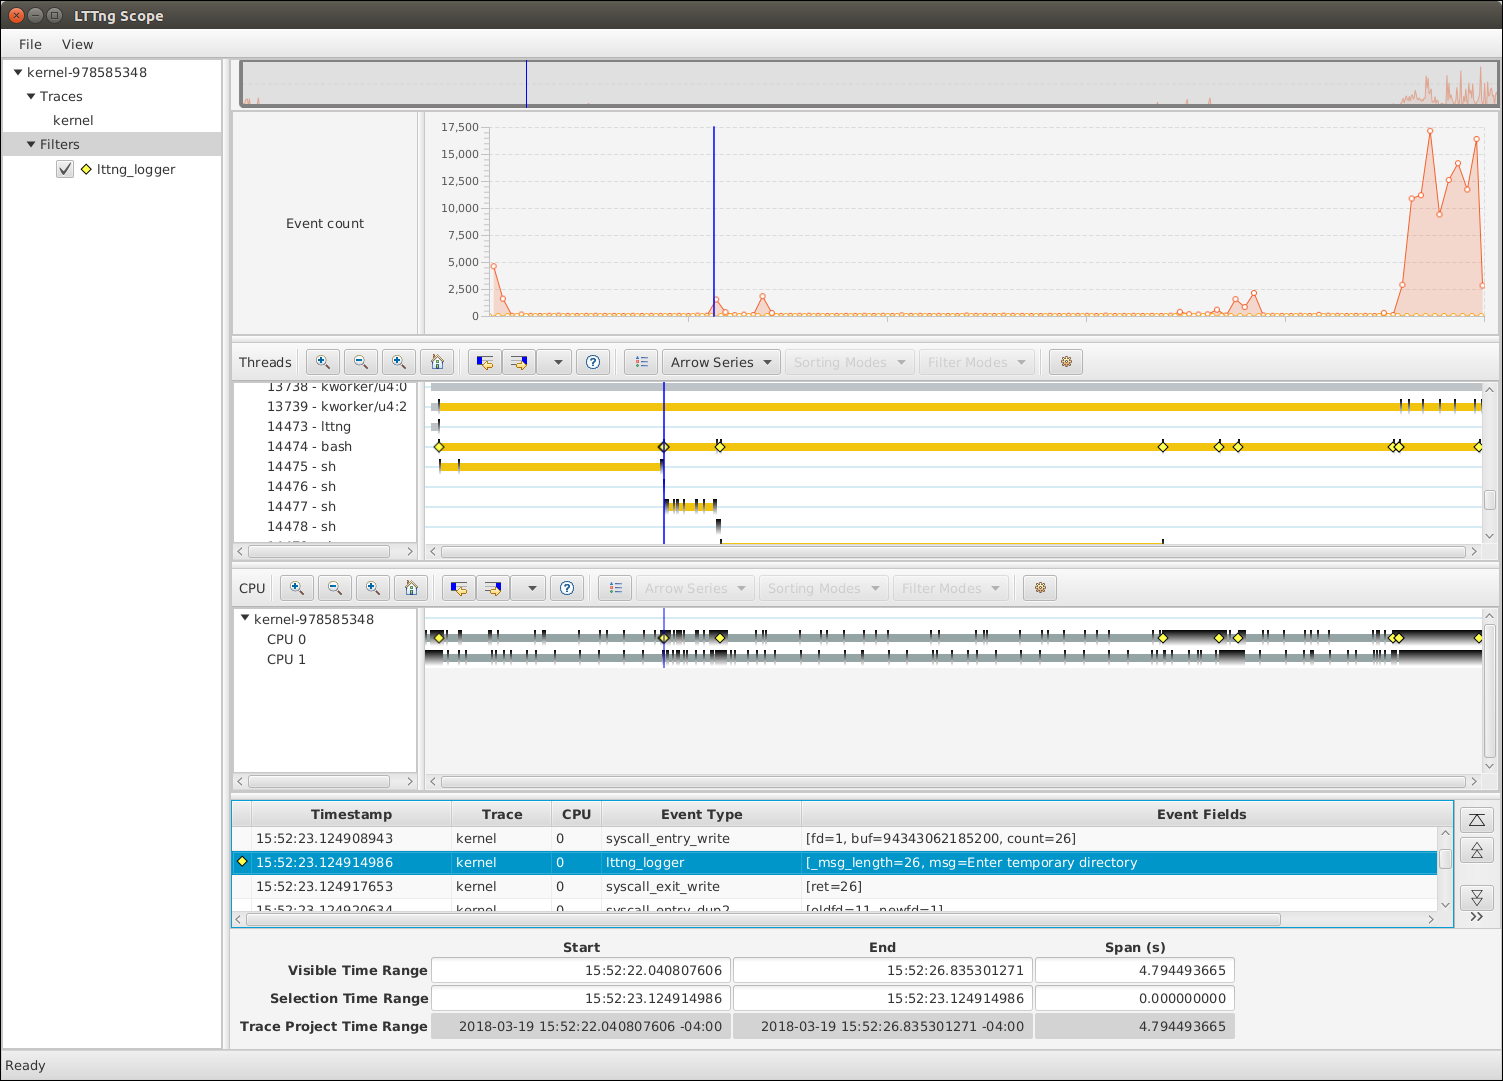
Let's zoom in on the first lttng_logger event:
- In the CPU view, click the first marker. This selects an event close to the marker and makes it the center point for zoom in actions.
- Hold the Ctrl key and scroll up with you mouse wheel until you're close to the maximum zoom level. You might have to fine-tune the selection to get the proper event.
On the following screenshot, we can see the lttng_logger event we
emitted before running ping -c 2 google.com. You can scroll down
the event list to see all the kernel events and system calls that
resulted from running the ping command.

LTTng Scope, fully zoomed on an lttng_logger event
That's it for now! I'll let you explore the trace. We'll post a more detailed guide once additional features are implemented in the tool.
Remember that this is a very early alpha release: there's a lot more to come!