The Linux Trace Toolkit: next generation is an open source software
toolkit which you can use to trace the Linux kernel, user applications,
and user libraries at the same time.
LTTng consists of:
Kernel modules to trace the Linux kernel.
Shared libraries to trace C/C++ user applications.
Java packages to trace Java applications which use java.util.logging
or Apache log4j 1.2.
A Python package to trace Python applications which use the standard
logging package.
A kernel module to trace shell scripts and other user applications
without a dedicated instrumentation mechanism.
Daemons and a command-line tool, lttng, to control the
LTTng tracers.
Open source documentation
Note:This is an open documentation: its source is available in a
public Git repository.
Should you find any error in the content of this text, any grammatical
mistake, or any dead link, we would be very grateful if you would file a
GitHub issue for it or, even better, contribute a patch to this
documentation by creating a pull request.
Target audience
The material of this documentation is appropriate for intermediate to
advanced software developers working in a Linux environment and
interested in efficient software tracing. LTTng is also worth a
try for students interested in the inner mechanics of their systems.
If you do not have a programming background, you may wish to skip
everything related to instrumentation, which often requires at least
some programming language skills.
What’s in this documentation?
The LTTng Documentation is divided into the following sections:
“Nuts and bolts” explains the
rudiments of software tracing and the rationale behind the
LTTng project.
Skip this section if you’re familiar with software tracing and with the
LTTng project.
“Installation” describes the steps to
install the LTTng packages on common Linux distributions and from
their sources.
Skip this section if you already properly installed LTTng on your target
system.
“Quick start” is a concise guide to
get started quickly with LTTng kernel and user space tracing.
We recommend this section if you’re new to LTTng or to software tracing
in general.
Skip this section if you’re not new to LTTng.
“Core concepts” explains the concepts at
the heart of LTTng.
It’s a good idea to become familiar with the core concepts
before attempting to use the toolkit.
“Components of LTTng” describes the various
components of the LTTng machinery, like the daemons, the libraries,
and the command-line interface.
“Instrumentation” shows different ways to
instrument user applications and the Linux kernel for LTTng tracing.
Instrumenting source code is essential to provide a meaningful
source of events.
Skip this section if you don’t have a programming background.
“Tracing control” is divided into topics
which demonstrate how to use the vast array of features that
LTTng 2.13 offers.
“Glossary” is a specialized dictionary of terms
related to LTTng or to the field of software tracing.
Convention
Function names, parameter names, variable names, command names, argument
names, file system paths, file names, and other literal strings are
written using a monospace typeface in this document. An italic
word within such a block is a placeholder, usually described in the
following sentence.
Practical tips and notes are given throughout the document using the
following style:
Tip:Read the tips.
Terminal boxes are used to show command lines:
$
#
echo Command line as a regular user
echo Command line as a the `root` user
Command lines which you need to execute as a priviledged user start with
the # prompt or with sudo. Other command lines start with the $
prompt.
Acknowledgements
A few people made the online LTTng Documentation possible.
Philippe Proulx wrote most of the content, created
the diagrams, and formatted the document. He’s the current maintainer
of the LTTng Documentation.
LTTng 2.13 bears the name Nordicité, the product of a
collaboration between Champ Libre and
Boréale. This farmhouse IPA is brewed with
Kveik yeast and Québec-grown
barley, oats, and juniper branches. The result is a remarkable, fruity,
hazy golden IPA that offers a balanced touch of resinous and woodsy
bitterness.
New features and changes in LTTng 2.13:
General
The LTTng trigger API of liblttng-ctl now
offers the “event rule matches” condition (an event rule matches an event) as well as the following new actions:
The LTTng user space and kernel
tracers offer the new namespace context field time_ns, which is the
inode number, in the proc file system, of the current clock namespace.
The manual pages of LTTng-tools now have a terminology and
style which match the LTTng Documentation, many fixes, more internal
and manual page links, clearer lists and procedures, superior
consistency, and usage examples.
The new lttng-event-rule(7) manual page explains the new, common
way to specify an event rule on the command line.
The new lttng-concepts(7) manual page explains the core concepts of
LTTng. Its contents is essentially the “Core concepts” section of this documentation, but more adapted to the
manual page style.
User space tracing
Important:The major version part of the liblttng-ustsoname is bumped, which means you
must recompile your instrumented applications/libraries and
tracepoint provider packages to use
LTTng-UST 2.13.
This change became a necessity to clean up the library and for
liblttng-ust to stop exporting private symbols.
Also, LTTng 2.13 prepends the lttng_ust_ and LTTNG_UST_
prefix to all public macro/definition/function names to offer a
consistent API namespace. The LTTng 2.12 API is still available;
see the “Compatibility with previous APIs” section of
lttng-ust(3).
The memory footprint of the kernel tracer is improved: the latter only
generates metadata for the specific system call recording event rules
that you create.
What is LTTng? As its name suggests, the Linux Trace Toolkit: next
generation is a modern toolkit for tracing Linux systems and
applications. So your first question might be:
what is tracing?
As the history of software engineering progressed and led to what
we now take for granted—complex, numerous and
interdependent software applications running in parallel on
sophisticated operating systems like Linux—the authors of such
components, software developers, began feeling a natural
urge to have tools that would ensure the robustness and good performance
of their masterpieces.
One major achievement in this field is, inarguably, the
GNU debugger (GDB),
an essential tool for developers to find and fix bugs. But even the best
debugger won’t help make your software run faster, and nowadays, faster
software means either more work done by the same hardware, or cheaper
hardware for the same work.
A profiler is often the tool of choice to identify performance
bottlenecks. Profiling is suitable to identify where performance is
lost in a given piece of software. The profiler outputs a profile, a
statistical summary of observed events, which you may use to discover
which functions took the most time to execute. However, a profiler won’t
report why some identified functions are the bottleneck. Bottlenecks
might only occur when specific conditions are met, conditions that are
sometimes impossible to capture by a statistical profiler, or impossible
to reproduce with an application altered by the overhead of an
event-based profiler. For a thorough investigation of software
performance issues, a history of execution is essential, with the
recorded values of variables and context fields you choose, and with as
little influence as possible on the instrumented application. This is
where tracing comes in handy.
Tracing is a technique used to understand what goes on in a running
software system. The piece of software used for tracing is called a
tracer, which is conceptually similar to a tape recorder. When
recording, specific instrumentation points placed in the software source
code generate events that are saved on a giant tape: a trace file. You
can record user application and operating system events at the same
time, opening the possibility of resolving a wide range of problems that
would otherwise be extremely challenging.
Tracing is often compared to logging. However, tracers and loggers are
two different tools, serving two different purposes. Tracers are
designed to record much lower-level events that occur much more
frequently than log messages, often in the range of thousands per
second, with very little execution overhead. Logging is more appropriate
for a very high-level analysis of less frequent events: user accesses,
exceptional conditions (errors and warnings, for example), database
transactions, instant messaging communications, and such. Simply put,
logging is one of the many use cases that can be satisfied with tracing.
The list of recorded events inside a trace file can be read manually
like a log file for the maximum level of detail, but it’s generally
much more interesting to perform application-specific analyses to
produce reduced statistics and graphs that are useful to resolve a
given problem. Trace viewers and analyzers are specialized tools
designed to do this.
In the end, this is what LTTng is: a powerful, open source set of
tools to trace the Linux kernel and user applications at the same time.
LTTng is composed of several components actively maintained and
developed by its community.
The dtrace tool interprets user scripts and is responsible for
loading code into the Linux kernel for further execution and collecting
the outputted data.
A subsystem in the Linux kernel in which a virtual machine can
execute programs passed from the user space to the kernel.
You can attach such programs to tracepoints and kprobes thanks to a
system call, and they can output data to the user space when executed
thanks to different mechanisms (pipe, VM register values, and eBPF maps,
to name a few).
Like SystemTap, uses scripts to analyze Linux kernel events.
You write scripts, or chisels in the jargon of sysdig, in Lua and
sysdig executes them while it traces the system or afterwards. The
interface of sysdig is the sysdig command-line tool as well as the
text UI-based csysdig tool.
A Linux kernel and user space tracer which uses custom user scripts
to produce plain text traces.
SystemTap converts the scripts to the C language, and then compiles them
as Linux kernel modules which are loaded to produce trace data. The
primary user interface of SystemTap is the stap command-line tool.
The main distinctive features of LTTng is that it produces correlated
kernel and user space traces, as well as doing so with the lowest
overhead amongst other solutions. It produces trace files in the
CTF format, a file format optimized
for the production and analyses of multi-gigabyte data.
LTTng is the result of more than 10 years of active open source
development by a community of passionate developers. LTTng is currently
available on major desktop and server Linux distributions.
The main interface for tracing control is a single command-line tool
named lttng. The latter can create several recording sessions, enable
and disable recording event rules on the fly, filter events efficiently
with custom user expressions, start and stop tracing, and much more.
LTTng can write the traces on the file system or send them over the
network, and keep them totally or partially. You can make LTTng execute
user-defined actions when LTTng emits an event. You can view the traces
once tracing becomes inactive or as LTTng records events.
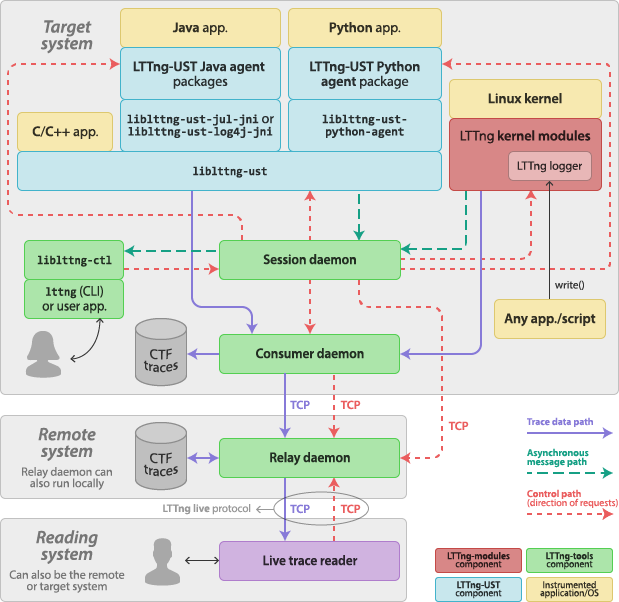
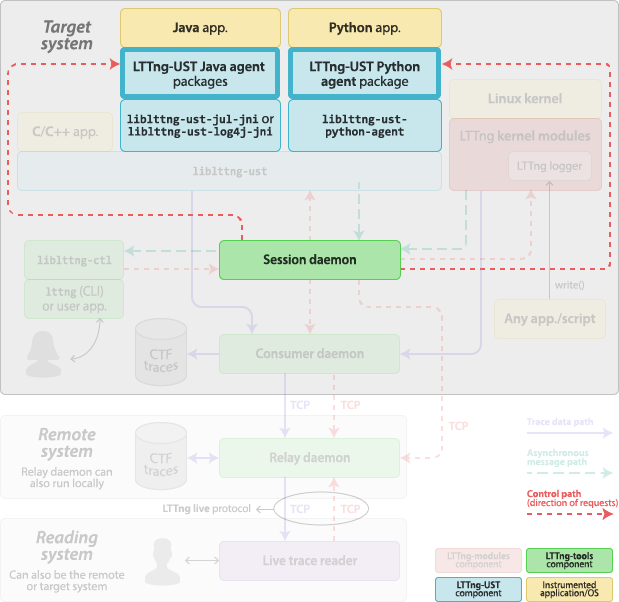
LTTng is a set of software components which interact to
instrument the Linux kernel and user applications, and
to control tracing (start and stop
recording, create recording event rules, and the rest). Those
components are bundled into the following packages:
LTTng-tools
Libraries and command-line interface to control tracing.
LTTng-modules
Linux kernel modules to instrument and trace the kernel.
LTTng-UST
Libraries and Java/Python packages to instrument and trace user
applications.
Most distributions mark the LTTng-modules and LTTng-UST packages as
optional when installing LTTng-tools (which is always required). In the
following sections, we always provide the steps to install all three,
but note that:
You only need to install LTTng-modules if you intend to use
the Linux kernel LTTng tracer.
You only need to install LTTng-UST if you intend to use the user
space LTTng tracer.
Download, build, and install the latest LTTng-modules 2.13:
$
cd $(mktemp -d) &&
wget https://lttng.org/files/lttng-modules/lttng-modules-latest-2.13.tar.bz2 &&
tar -xf lttng-modules-latest-2.13.tar.bz2 &&
cd lttng-modules-2.13.* &&
make &&
sudo make modules_install &&
sudo depmod -a
Download, build, and install the latest LTTng-UST 2.13:
$
cd $(mktemp -d) &&
wget https://lttng.org/files/lttng-ust/lttng-ust-latest-2.13.tar.bz2 &&
tar -xf lttng-ust-latest-2.13.tar.bz2 &&
cd lttng-ust-2.13.* &&
./configure &&
make &&
sudo make install &&
sudo ldconfig
Add --disable-numa to ./configure if you don’t have
numactl.
Java and Python application tracing
Important:If you need to instrument and have LTTng trace Java applications, pass the --enable-java-agent-jul,
--enable-java-agent-log4j, or --enable-java-agent-all options to the
configure script, depending on which Java logging framework you use.
If you need to instrument and have LTTng trace
Python applications, pass the
--enable-python-agent option to the configure script. You can set
the PYTHON environment variable to the path to the Python interpreter
for which to install the LTTng-UST Python agent package.
Note:By default, LTTng-UST libraries are installed to
/usr/local/lib, which is the de facto directory in which to
keep self-compiled and third-party libraries.
Append /usr/local/lib to the LD_LIBRARY_PATH environment
variable.
Pass the -L/usr/local/lib and -Wl,-rpath,/usr/local/lib options to
gcc(1), g++(1), or clang(1).
Download, build, and install the latest LTTng-tools 2.13:
$
cd $(mktemp -d) &&
wget https://lttng.org/files/lttng-tools/lttng-tools-latest-2.13.tar.bz2 &&
tar -xf lttng-tools-latest-2.13.tar.bz2 &&
cd lttng-tools-2.13.* &&
./configure &&
make &&
sudo make install &&
sudo ldconfig
Tip:The vlttng tool can do all the
previous steps automatically for a given version of LTTng and confine
the installed files to a specific directory. This can be useful to try
LTTng without installing it on your system.
The Linux kernel which boots is configured with
CONFIG_MODULE_SIG_FORCE.
The Linux kernel boots with a command line containing
module.sig_enforce=1.
Example:root user running lttng-sessiond which fails to load a required kernel module due to the signature enforcement policies.
#
lttng-sessiond
Warning: No tracing group detected
modprobe: ERROR: could not insert 'lttng_ring_buffer_client_discard': Key was rejected by service
Error: Unable to load required module lttng-ring-buffer-client-discard
Warning: No kernel tracer available
There are several methods to enroll trusted keys for signing modules
that are built from source. The precise details vary from one Linux
version to another, and distributions may have their own mechanisms. For
example, DKMS may autogenerate a key and
sign modules, but the key isn’t automatically enrolled.
See
Kernel
module signing facility and the documentation of your distribution
to learn more about signing Linux kernel modules.
Note:The following command lines start with the # prompt because you
need root privileges to control the Linux kernel LTTng tracer. You can
also control the kernel tracer as a regular user if your Unix user is a
member of the tracing group.
Create a recording session to write LTTng traces
to /tmp/my-kernel-trace:
List the available kernel tracepoints and system calls:
#
#
lttng list --kernel
lttng list --kernel --syscall
Create recording event rules which match events having
the desired names, for example the sched_switch and
sched_process_fork tracepoints, and the open(2) and close(2)
system calls:
Create a recording event rule which matches all the Linux kernel
tracepoint events with the --all option
(recording with such a recording event rule generates a lot of data):
#include<stdio.h>#include"hello-tp.h"intmain(intargc,char*argv[]){unsignedinti;puts("Hello, World!\nPress Enter to continue...");/* * The following getchar() call only exists for the purpose of this * demonstration, to pause the application in order for you to have * time to list its tracepoints. You don't need it otherwise. */getchar();/* * An lttng_ust_tracepoint() call. * * Arguments, as defined in `hello-tp.h`: * * 1. Tracepoint provider name (required) * 2. Tracepoint name (required) * 3. `my_integer_arg` (first user-defined argument) * 4. `my_string_arg` (second user-defined argument) * * Notice the tracepoint provider and tracepoint names are * C identifiers, NOT strings: they're in fact parts of variables * that the macros in `hello-tp.h` create. */lttng_ust_tracepoint(hello_world,my_first_tracepoint,23,"hi there!");for(i=0;i<argc;i++){lttng_ust_tracepoint(hello_world,my_first_tracepoint,i,argv[i]);}puts("Quitting now!");lttng_ust_tracepoint(hello_world,my_first_tracepoint,i*i,"i^2");return0;}
Build the application:
$
gcc -c hello.c
Link the application with the tracepoint provider package,
liblttng-ust and libdl:
Go back to the running hello application and press Enter.
The program executes all lttng_ust_tracepoint() instrumentation
points, emitting events as the event rule you created in step 5
matches them, and
exits.
By default, LTTng saves the traces to the
$LTTNG_HOME/lttng-traces/NAME-DATE-TIME directory, where
NAME is the recording session name. The LTTNG_HOME environment
variable defaults to $HOME if not set.
A rich, flexible trace manipulation toolkit which includes
a versatile command-line interface
(babeltrace2(1)),
a C library,
and Python 3 bindings
so that you can easily process or convert an LTTng trace with
your own script.
The Babeltrace 2 project ships with a plugin
(babeltrace2-plugin-ctf(7)) which supports the format of the traces
which LTTng produces, CTF.
A graphical user interface for viewing and analyzing any type of
logs or traces, including those of LTTng.
Note:This section assumes that LTTng wrote the traces it recorded
during the previous tutorials to their default location, in the
$LTTNG_HOME/lttng-traces directory. The LTTNG_HOME
environment variable defaults to $HOME if not set.
The text output of babeltrace2 is useful to isolate event records by simple matching
using grep(1) and similar utilities. However, more elaborate
filters, such as keeping only event records with a field value falling
within a specific range, are not trivial to write using a shell.
Moreover, reductions and even the most basic computations involving
multiple event records are virtually impossible to implement.
Fortunately, Babeltrace 2 ships with
Python 3 bindings
which make it easy to read the event records of an LTTng trace
sequentially and compute the desired information.
The following script accepts an LTTng Linux kernel trace path as its
first argument and prints the short names of the top five running
processes on CPU 0 during the whole trace:
top5proc.py
importbt2importsysimportcollectionsdeftop5proc():# Get the trace path from the first command-line argumentit=bt2.TraceCollectionMessageIterator(sys.argv[1])# This counter dictionary will hold execution times:## Task command name -> Total execution time (ns)exec_times=collections.Counter()# This holds the last `sched_switch` timestamplast_ts=Noneformsginit:# We only care about event messagesiftype(msg)isnotbt2._EventMessageConst:continue# Event of the event messageevent=msg.event# Keep only `sched_switch` eventsifevent.cls.name!='sched_switch':continue# Keep only records of events which LTTng emitted from CPU 0ifevent.packet.context_field['cpu_id']!=0:continue# Event timestamp (ns)cur_ts=msg.default_clock_snapshot.ns_from_originiflast_tsisNone:# Start herelast_ts=cur_ts# (Short) name of the previous task commandprev_comm=str(event.payload_field['prev_comm'])# Initialize an entry in our dictionary if not done yetifprev_commnotinexec_times:exec_times[prev_comm]=0# Compute previous command execution timediff=cur_ts-last_ts# Update execution time of this commandexec_times[prev_comm]+=diff# Update last timestamplast_ts=cur_ts# Print top 5forname,nsinexec_times.most_common(5):print('{:20}{} s'.format(name,ns/1e9))if__name__=='__main__':top5proc()
Run this script:
$
python3 top5proc.py /tmp/my-kernel-trace/kernel
Output example:
swapper/0           48.607245889 s
chromium            7.192738188 s
pavucontrol         0.709894415 s
Compositor          0.660867933 s
Xorg.bin            0.616753786 s
Note that swapper/0 is the “idle” process of CPU 0 on Linux;
since we weren’t using the CPU that much when recording, its first
position in the list makes sense.
An event rule is a set of conditions to match a set of events.
When LTTng creates an event E, an event rule ER is
said to matchE when E satisfies all the
conditions of ER. This concept is similar to a
regular expression
which matches a set of strings.
When an event rule matches an event, LTTng emits the event, therefore
attempting to execute one or more actions.
Important:The event creation and emission
processes are documentation concepts to help understand the journey from
an instrumentation point to the execution of actions.
The actual creation of an event can be costly because LTTng needs to
evaluate the arguments of the instrumentation point.
In practice, LTTng implements various optimizations for the Linux kernel
and user space tracing domains to avoid actually creating an
event when the tracer knows, thanks to properties which are independent
from the event payload and current context, that it would never emit
such an event. Those properties are:
In other words: if, for a given instrumentation point IP, the
LTTng tracer knows that it would never emit an event,
executing IP represents a simple boolean variable check and,
for a Linux kernel recording event rule, a few process attribute checks.
As of LTTng 2.13, there are two places where you can find an
event rule:
When the event rule of the trigger condition matches an event, LTTng
can execute user-defined actions such as sending an LTTng
notification,
starting a recording session,
and more.
A trigger belongs to a session daemon, not to a
specific recording session. For a given session daemon, each Unix user has
its own, private triggers. Note, however, that the root Unix user may,
for the root session daemon:
Add a trigger as another Unix user.
List all the triggers, regardless of their owner.
Remove a trigger which belongs to another Unix user.
For a given session daemon and Unix user, a trigger has a unique name.
A recording session (named “tracing session” prior to
LTTng 2.13) is a stateful dialogue between you and a
session daemon for everything related to
event recording.
Everything that you do when you control LTTng tracers to record events
happens within a recording session. In particular, a recording session:
Has its own name, unique for a given session daemon.
Has its own set of trace files, if any.
Has its own state of activity (started or stopped).
Those attributes and objects are completely isolated between different
recording sessions.
A recording session is like an
ATM session: the
operations you do on the banking system through the ATM don’t alter the
data of other users of the same system. In the case of the ATM, a
session lasts as long as your bank card is inside. In the case of LTTng,
a recording session lasts from the lttng-create(1) command to the
lttng-destroy(1) command.
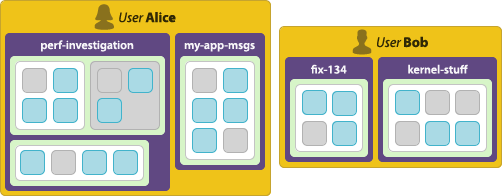
Each Unix user has its own set of recording sessions.
A recording session belongs to a session daemon. For a
given session daemon, each Unix user has its own, private recording
sessions. Note, however, that the root Unix user may operate on or
destroy another user’s recording session.
A tracing domain identifies a type of LTTng tracer.
A tracing domain has its own properties and features.
There are currently five available tracing domains:
Linux kernel
User space
java.util.logging (JUL)
log4j
Python
You must specify a tracing domain to target a type of LTTng tracer when
using some lttng commands to avoid ambiguity. For
example, because the Linux kernel and user space tracing domains support
named tracepoints as instrumentation points, you need to
specify a tracing domain when you create an event rule because both tracing domains could have tracepoints
sharing the same name.
You can create channels in the Linux kernel and user space
tracing domains. The other tracing domains have a single, default
channel.
A channel is an object which is responsible for a set of
ring buffers.
Each ring buffer is divided into multiple sub-buffers. When a
recording event rule
matches an event, LTTng can record it to one or more sub-buffers of one
or more channels.
When you create a channel, you set its
final attributes, that is:
A channel is always associated to a tracing domain. The
java.util.logging (JUL), log4j, and Python tracing domains each have a
default channel which you can’t configure.
A channel has at least one ring buffer per CPU. LTTng always records
an event to the ring buffer dedicated to the CPU which emits it.
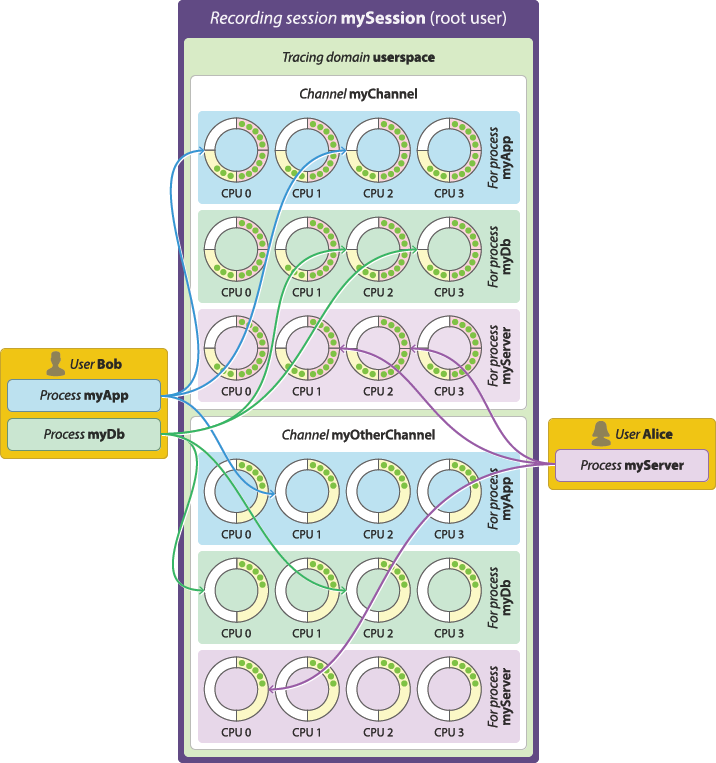
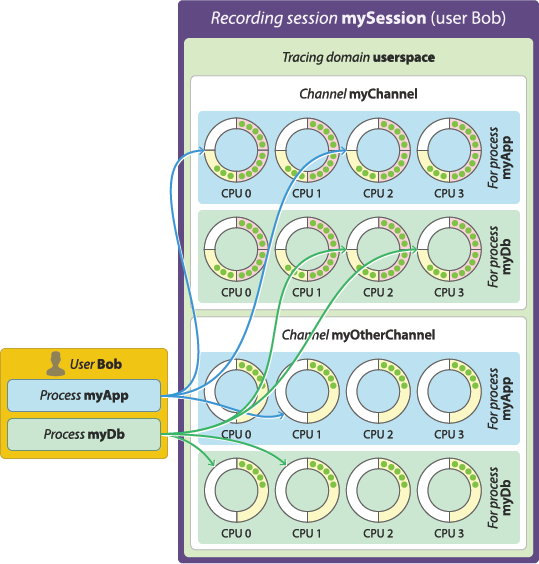
The buffering scheme of a user space channel determines what has its own
set of per-CPU ring buffers:
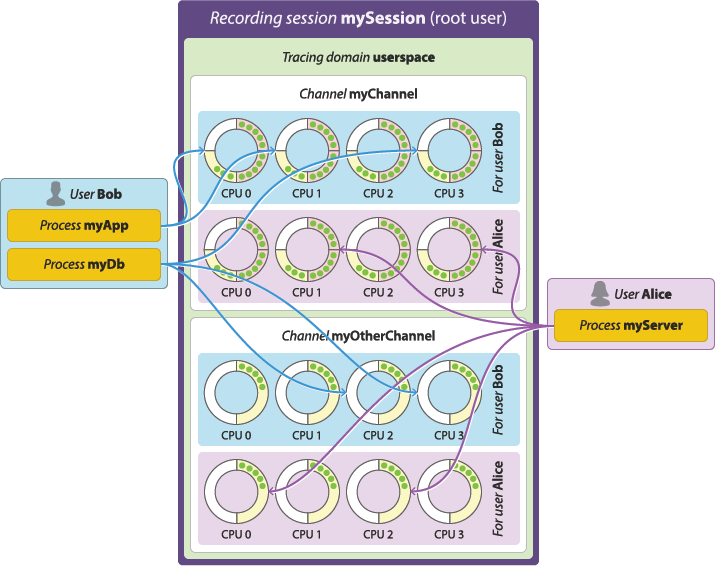
Per-user buffering
Allocate one set of ring buffers—one per CPU—shared by all the
instrumented processes of:
If your Unix user is root
Each Unix user.
Per-user buffering scheme (recording session belongs to the root Unix user).
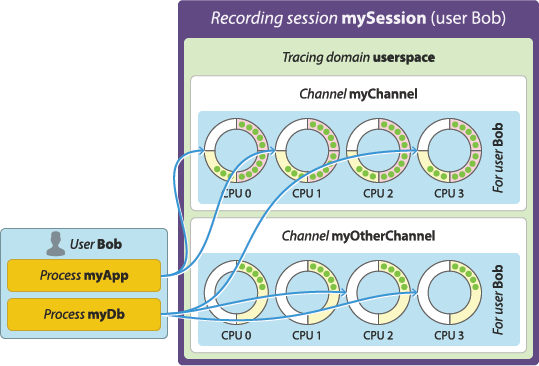
Otherwise
Your Unix user.
Per-user buffering scheme (recording session belongs to the Bob Unix user).
Per-process buffering
Allocate one set of ring buffers—one per CPU—for each
instrumented process of:
If your Unix user is root
All Unix users.
Per-process buffering scheme (recording session belongs to the root Unix user).
Otherwise
Your Unix user.
Per-process buffering scheme (recording session belongs to the Bob Unix user).
The per-process buffering scheme tends to consume more memory than the
per-user option because systems generally have more instrumented
processes than Unix users running instrumented processes. However, the
per-process buffering scheme ensures that one process having a high
event throughput won’t fill all the shared sub-buffers of the same Unix
user, only its own.
The buffering scheme of a Linux kernel channel is always to allocate a
single set of ring buffers for the whole system. This scheme is similar
to the per-user option, but with a single, global user “running” the
kernel.
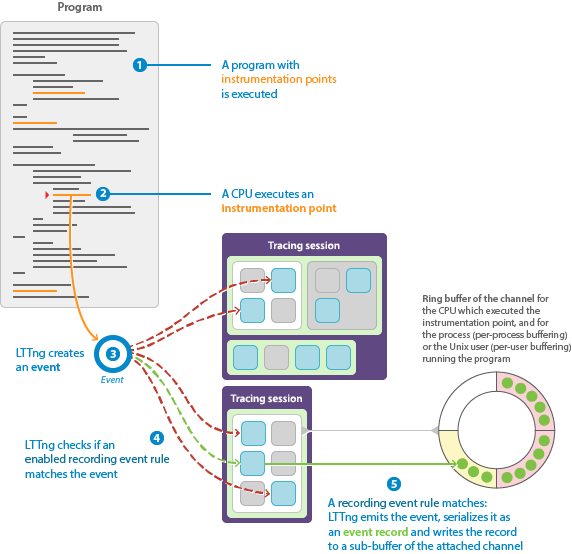
When LTTng emits an event, LTTng can record it to a specific, available
sub-buffer within the ring buffers of specific channels. When there’s no
space left in a sub-buffer, the tracer marks it as consumable and
another, available sub-buffer starts receiving the following event
records. An LTTng consumer daemon eventually
consumes the marked sub-buffer, which returns to the available state.
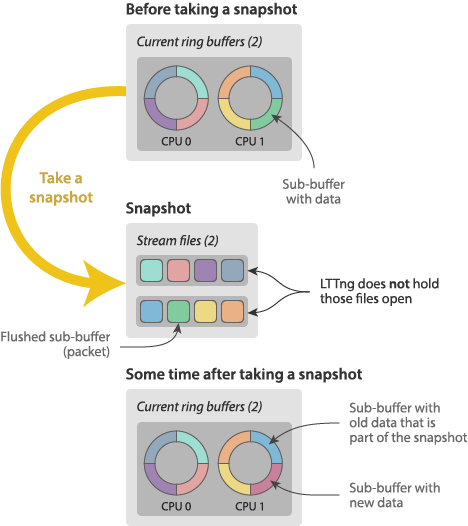
In an ideal world, sub-buffers are consumed faster than they’re filled,
as it’s the case in the previous animation. In the real world,
however, all sub-buffers can be full at some point, leaving no space to
record the following events.
By default, LTTng-modules and LTTng-UST
are non-blocking tracers: when there’s no available sub-buffer to
record an event, it’s acceptable to lose event records when the
alternative would be to cause substantial delays in the execution of the
instrumented application. LTTng privileges performance over integrity;
it aims at perturbing the instrumented application as little as possible
in order to make the detection of subtle race conditions and rare
interrupt cascades possible.
Since LTTng 2.10, the LTTng user space tracer, LTTng-UST, supports
a blocking mode. See the blocking timeout example to learn how to use the blocking mode.
When it comes to losing event records because there’s no available
sub-buffer, or because the blocking timeout of
the channel is reached, the event record loss mode of the channel
determines what to do. The available event record loss modes are:
Discard mode
Drop the newest event records until a sub-buffer becomes available.
This is the only available mode when you specify a blocking timeout.
With this mode, LTTng increments a count of lost event records when an
event record is lost and saves this count to the trace. A trace reader
can use the saved discarded event record count of the trace to decide
whether or not to perform some analysis even if trace data is known to
be missing.
Overwrite mode
Clear the sub-buffer containing the oldest event records and start
writing the newest event records there.
This mode is sometimes called flight recorder mode because it’s
similar to a flight
recorder: always keep a fixed amount of the latest data. It’s also
similar to the roll mode of an oscilloscope.
Since LTTng 2.8, with this mode, LTTng writes to a given sub-buffer
its sequence number within its data stream. With a local,
network streaming, or live recording
session, a trace reader can use such sequence numbers to report lost
packets. A trace reader can use the saved discarded sub-buffer (packet)
count of the trace to decide whether or not to perform some analysis
even if trace data is known to be missing.
With this mode, LTTng doesn’t write to the trace the exact number of
lost event records in the lost sub-buffers.
Which mechanism you should choose depends on your context: prioritize
the newest or the oldest event records in the ring buffer?
Beware that, in overwrite mode, the tracer abandons a whole sub-buffer
as soon as a there’s no space left for a new event record, whereas in
discard mode, the tracer only discards the event record that doesn’t
fit.
There are a few ways to decrease your probability of losing event
records. The “Sub-buffer size and count” section shows how to fine-tune the sub-buffer size and count
of a channel to virtually stop losing event records, though at the cost
of greater memory usage.
A channel has one or more ring buffer for each CPU of the target system.
See the “Buffering scheme” section to
learn how many ring buffers of a given channel are dedicated to each CPU
depending on its buffering scheme.
Set the size of each sub-buffer the ring buffers of a channel contain
and how many there are
when you create it.
Note that LTTng switching the current sub-buffer of a ring buffer
(marking a full one as consumable and switching to an available one for
LTTng to record the next events) introduces noticeable CPU overhead.
Knowing this, the following list presents a few practical situations
along with how to configure the sub-buffer size and count for them:
High event throughput
In general, prefer large sub-buffers to lower the risk of losing
event records.
Having larger sub-buffers also ensures a lower sub-buffer switching
frequency.
The sub-buffer count is only meaningful if you create the channel in
overwrite mode: in this case, if LTTng overwrites a
sub-buffer, then the other sub-buffers are left unaltered.
Low event throughput
In general, prefer smaller sub-buffers since the risk of losing
event records is low.
Because LTTng emits events less frequently, the sub-buffer switching
frequency should remain low and therefore the overhead of the tracer
shouldn’t be a problem.
Low memory system
If your target system has a low memory limit, prefer fewer first,
then smaller sub-buffers.
Even if the system is limited in memory, you want to keep the
sub-buffers as large as possible to avoid a high sub-buffer switching
frequency.
Note that LTTng uses CTF as its trace format,
which means event record data is very compact. For example, the average
LTTng kernel event record weighs about 32 bytes. Therefore, a
sub-buffer size of 1 MiB is considered large.
The previous scenarios highlight the major trade-off between a few large
sub-buffers and more, smaller sub-buffers: sub-buffer switching
frequency vs. how many event records are lost in overwrite mode.
Assuming a constant event throughput and using the overwrite mode, the
two following configurations have the same ring buffer total size:
Two sub-buffers of 4 MiB each
Expect a very low sub-buffer switching frequency, but if LTTng
ever needs to overwrite a sub-buffer, half of the event records so
far (4 MiB) are definitely lost.
Eight sub-buffers of 1 MiB each
Expect four times the tracer overhead of the configuration above,
but if LTTng needs to overwrite a sub-buffer, only the eighth of
event records so far (1 MiB) are definitely lost.
In discard mode, the sub-buffer count parameter is
pointless: use two sub-buffers and set their size according to your
requirements.
By default, trace files can grow as large as needed.
Set the maximum size of each trace file that LTTng writes of a given
channel when you create it.
When the size of a trace file reaches the fixed maximum size of the
channel, LTTng creates another file to contain the next event records.
LTTng appends a file count to each trace file name in this case.
If you set the trace file size attribute when you create a channel, the
maximum number of trace files that LTTng creates is unlimited by
default. To limit them, set a maximum number of trace files. When the
number of trace files reaches the fixed maximum count of the channel,
LTTng overwrites the oldest trace file. This mechanism is called trace
file rotation.
Important:Even if you don’t limit the trace file count, always assume that LTTng
manages all the trace files of the recording session.
In other words, there’s no safe way to know if LTTng still holds a given
trace file open with the trace file rotation feature.
Each channel can have up to three optional timers:
Switch timer
When this timer expires, a sub-buffer switch happens: for each ring
buffer of the channel, LTTng marks the current sub-buffer as
consumable and switches to an available one to record the next
events.
A switch timer is useful to ensure that LTTng consumes and commits trace
data to trace files or to a distant relay daemon
periodically in case of a low event throughput.
Such a timer is also convenient when you use large
sub-buffers to cope with a
sporadic high event throughput, even if the throughput is otherwise low.
Set the period of the switch timer of a channel when you
create it with
the --switch-timer option.
Read timer
When this timer expires, LTTng checks for full, consumable
sub-buffers.
By default, the LTTng tracers use an asynchronous message mechanism to
signal a full sub-buffer so that a consumer daemon
can consume it.
When such messages must be avoided, for example in real-time
applications, use this timer instead.
Set the period of the read timer of a channel when you
create it with the
--read-timer option.
Monitor timer
When this timer expires, the consumer daemon samples some channel
statistics to evaluate the following trigger
conditions:
The consumed buffer size of a given recording session becomes greater than some value.
The buffer usage of a given channel becomes greater than some value.
The buffer usage of a given channel becomes less than some value.
If you disable the monitor timer of a channel C:
The consumed buffer size value of the recording session of C
could be wrong for trigger condition type 1: the consumed buffer
size of C won’t be part of the grand total.
The buffer usage trigger conditions (types 2 and 3)
for C will never be satisfied.
Set the period of the monitor timer of a channel when you
create it with the
--monitor-timer option.
All processes are allowed to record events on recording session
creation.
You always attach a recording event rule to a channel, which belongs to
a recording session, when you create it.
When a recording event rule ER matches an event E,
LTTng attempts to serialize and record E to one of the
available sub-buffers of the channel to which E is attached.
When multiple matching recording event rules are attached to the same
channel, LTTng attempts to serialize and record the matched event
once. In the following example, the second recording event rule is
redundant when both are enabled:
Use liblttng-ctl in C or C++ source code by including its
“master” header:
#include<lttng/lttng.h>
As of LTTng 2.13, the best available developer documentation
for liblttng-ctl is its installed header files. Functions and
structures are documented with header comments.
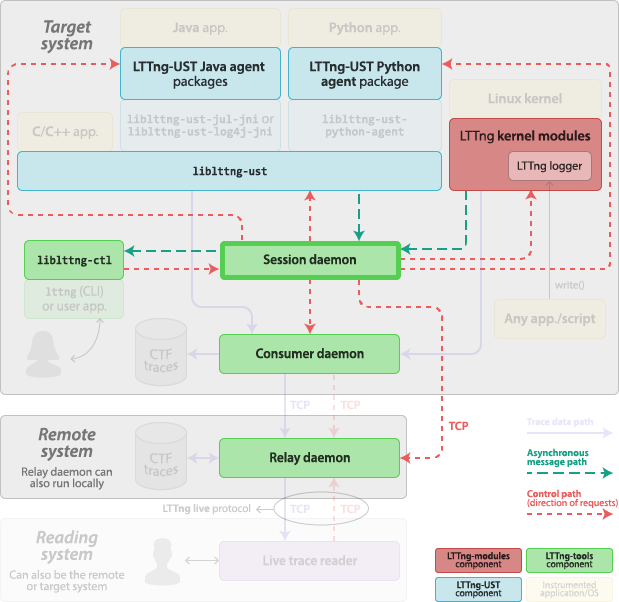
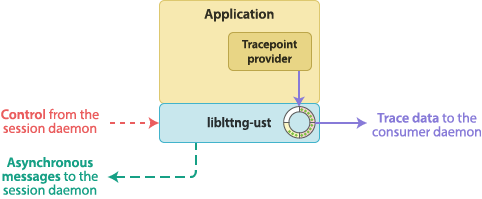
The user space tracing library, liblttng-ust (see lttng-ust(3)),
is the LTTng user space tracer.
liblttng-ust receives commands from a session daemon, for example to allow specific instrumentation points to emit
LTTng events, and writes event records to ring buffers shared with a consumer daemon.
An application or library doesn’t have to initialize liblttng-ust
manually: its constructor does the necessary tasks to register the
application to a session daemon. The initialization phase also
configures instrumentation points depending on the event rules that you already created.
In the case of Python, the standard
logging package
is supported. Both Python 2 and Python 3 modules can import the
LTTng-UST Python agent package.
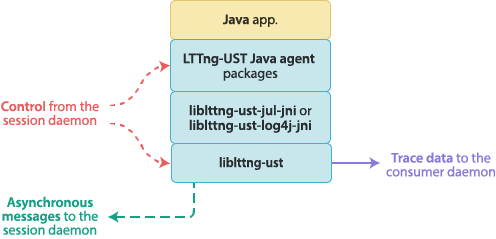
The applications using the LTTng-UST agents are in the
java.util.logging (JUL), log4j, and Python tracing domains.
Both agents use the same mechanism to convert log statements to LTTng
events. When an agent initializes, it creates a log handler that
attaches to the root logger. The agent also registers to a
session daemon. When the user application executes a
log statement, the root logger passes it to the log handler of the
agent. The custom log handler of the agent calls a native function in a
tracepoint provider package shared library linked with
liblttng-ust, passing the formatted log message and
other fields, like its logger name and its log level. This native
function contains a user space instrumentation point, therefore tracing
the log statement.
The log level condition of a recording event rule is
considered when tracing a Java or a Python application, and it’s
compatible with the standard java.util.logging, log4j, and Python log
levels.
The LTTng logger module implements the special /proc/lttng-logger
(and /dev/lttng-logger, since LTTng 2.11) files so that any
executable can generate LTTng events by opening those files and
writing to them.
Generally, you don’t have to load the LTTng kernel modules manually
(using modprobe(8), for example): a root session daemon loads the
necessary modules when starting. If you have extra probe modules, you
can specify to load them to the session daemon on the command line
(see the --extra-kmod-probes option). See also
Linux kernel module signature.
The LTTng kernel modules are installed in
/usr/lib/modules/release/extra by default, where release is
the kernel release (output of uname --kernel-release).
Any instance of the user space tracing library first registers to
a session daemon. Then, the session daemon can send requests to
this instance, such as:
Get the list of tracepoints.
Share a recording event rule so that the user space tracing
library can decide whether or not a given tracepoint can emit events.
Amongst the possible conditions of a recording event rule is a filter
expression which liblttng-ust evaluates before it emits an event.
Share channel attributes and ring buffer locations.
The session daemon and the user space tracing library use a Unix
domain socket to communicate.
The session daemon doesn’t send and receive trace data: this is the
role of the consumer daemon and
relay daemon. It does, however, generate the
CTF metadata stream.
Each Unix user can have its own session daemon instance. The
recording sessions which different session daemons manage are completely
independent.
The root user’s session daemon is the only one which is
allowed to control the LTTng kernel tracer, and its spawned consumer
daemon is the only one which is allowed to consume trace data from the
LTTng kernel tracer. Note, however, that any Unix user which is a member
of the tracing group is allowed
to create channels in the
Linux kernel tracing domain, and therefore to use the Linux
kernel LTTng tracer.
The lttng command-line tool automatically starts a
session daemon when using its create command if none is currently
running. You can also start the session daemon manually.
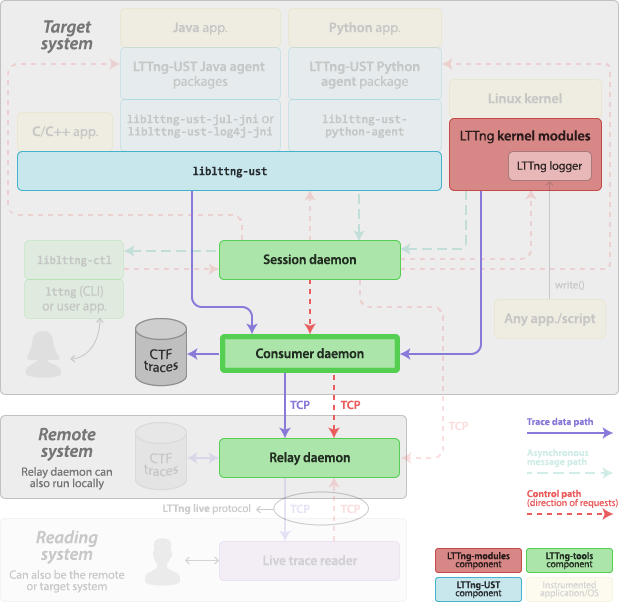
The consumer daemon, lttng-consumerd, is a
daemon which shares
ring buffers with user applications or with the LTTng kernel modules to
collect trace data and send it to some location (file system or to a
relay daemon over the network).
The consumer daemon is part of LTTng-tools.
You don’t start a consumer daemon manually: a consumer daemon is always
spawned by a session daemon as soon as you create a
recording event rule, that is, before you start recording. When
you kill its owner session daemon, the consumer daemon also exits
because it’s the child process of the session daemon. Command-line
options of lttng-sessiond(8) target the consumer daemon process.
There are up to two running consumer daemons per Unix user, whereas only
one session daemon can run per user. This is because each process can be
either 32-bit or 64-bit: if the target system runs a mixture of 32-bit
and 64-bit processes, it’s more efficient to have separate
corresponding 32-bit and 64-bit consumer daemons. The root user is an
exception: it can have up to three running consumer daemons: 32-bit
and 64-bit instances for its user applications, and one more
reserved for collecting kernel trace data.
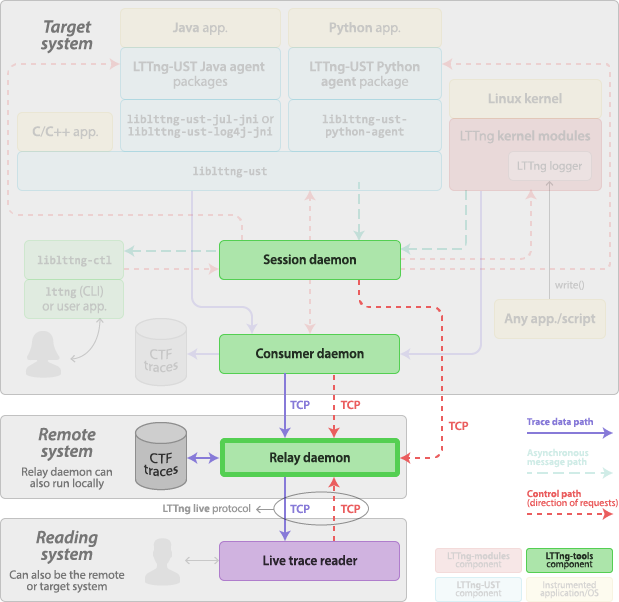
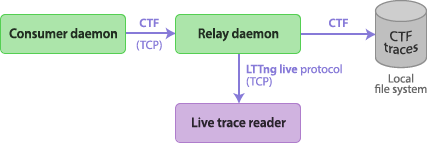
The relay daemon, lttng-relayd(8), is a
daemon acting as a bridge
between remote session and consumer daemons, local trace files, and a
remote live trace reader.
The relay daemon is part of LTTng-tools.
The main purpose of the relay daemon is to implement a receiver of
trace data over the network.
This is useful when the target system doesn’t have much file system
space to write trace files locally.
The relay daemon is also a server to which a
live trace reader can
connect. The live trace reader sends requests to the relay daemon to
receive trace data as the target system records events. The
communication protocol is named LTTng live; it’s used over TCP
connections.
Note that you can start the relay daemon on the target system directly.
This is the setup of choice when the use case is to view/analyze events
as the target system records them without the need of a remote system.
There are many examples of tracing and monitoring in our everyday life:
You have access to real-time and historical weather reports and
forecasts thanks to weather stations installed around the country.
You know your heart is safe thanks to an electrocardiogram.
You make sure not to drive your car too fast and to have enough fuel
to reach your destination thanks to gauges visible on your dashboard.
All the previous examples have something in common: they rely on
instruments. Without the electrodes attached to the surface of your
body skin, cardiac monitoring is futile.
LTTng, as a tracer, is no different from those real life examples. If
you’re about to trace a software system or, in other words, record its
history of execution, you better have instrumentation points in the
subject you’re tracing, that is, the actual software system.
Various ways were developed to
instrument a piece of software for LTTng tracing. The most
straightforward one is to manually place static instrumentation points,
called tracepoints, in the source code of the application. The Linux
kernel tracing domain also makes it possible to dynamically
add instrumentation points.
If you’re only interested in tracing the Linux kernel, your
instrumentation needs are probably already covered by the built-in
Linux kernel instrumentation points of LTTng. You may
also wish to have LTTng trace a user application which is already
instrumented for LTTng tracing. In such cases, skip this whole section
and read the topics of the “Tracing control”
section.
Many methods are available to instrument a piece of software for LTTng
tracing:
A tracepoint provider is a set of compiled functions which provide
tracepoints to an application, the type of instrumentation point
which LTTng-UST provides.
Those functions can make LTTng emit events with user-defined fields and
serialize those events as event records to one or more LTTng-UST
channel sub-buffers. The lttng_ust_tracepoint() macro,
which you insert in the source code of a user application, calls those functions.
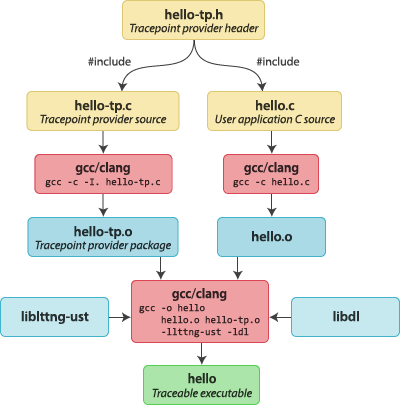
A tracepoint provider package is an object file (.o) or a shared
library (.so) which contains one or more tracepoint providers. Its
source files are:
Your tracepoint provider name must be unique amongst all the possible
tracepoint provider names used on the same target system. We suggest to
include the name of your project or company in the name, for example,
org_lttng_my_project_tpp.
A tracepoint definition defines, for a given tracepoint:
Its input arguments.
They’re the macro parameters that the lttng_ust_tracepoint() macro
accepts for this particular tracepoint in the source code of the user
application.
Its output event fields.
They’re the sources of event fields that form the payload of any event
that the execution of the lttng_ust_tracepoint() macro emits for this
particular tracepoint.
Create a tracepoint definition with the
LTTNG_UST_TRACEPOINT_EVENT() macro below the #include <lttng/tracepoint.h>
line in the
tracepoint provider header file template.
The syntax of the LTTNG_UST_TRACEPOINT_EVENT() macro is:
LTTNG_UST_TRACEPOINT_EVENT() macro syntax.
LTTNG_UST_TRACEPOINT_EVENT(/* Tracepoint provider name */provider_name,/* Tracepoint name */tracepoint_name,/* Input arguments */LTTNG_UST_TP_ARGS(arguments),/* Output event fields */LTTNG_UST_TP_FIELDS(fields))
The full name of this tracepoint is provider_name:tracepoint_name.
Event name length limitation
Important:The concatenation of the tracepoint provider name and the tracepoint
name must not exceed 254 characters. If it does, the
instrumented application compiles and runs, but LTTng throws multiple
warnings and you could experience serious issues.
The syntax of the LTTNG_UST_TP_ARGS() macro is:
LTTNG_UST_TP_ARGS() macro syntax.
LTTNG_UST_TP_ARGS(type,arg_name)
Replace:
type with the C type of the argument.
arg_name with the argument name.
You can repeat type and arg_name up to 10 times to have
more than one argument.
Example:LTTNG_UST_TP_ARGS() usage with three arguments.
The LTTNG_UST_TP_ARGS() and LTTNG_UST_TP_ARGS(void) forms are valid
to create a tracepoint definition with no input arguments.
The LTTNG_UST_TP_FIELDS() macro contains a
list of lttng_ust_field_*() macros. Each lttng_ust_field_*() macro
defines one event field. See lttng-ust(3) for a complete description
of the available lttng_ust_field_*() macros. A lttng_ust_field_*()
macro specifies the type, size, and byte order of one event field.
Each lttng_ust_field_*() macro takes an argument expression
parameter. This is a C expression that the tracer evaluates at the
lttng_ust_tracepoint() macro site in the source code of the
application. This expression provides the source of data of a field. The
argument expression can include input argument names listed in the
LTTNG_UST_TP_ARGS() macro.
Each lttng_ust_field_*() macro also takes a field name parameter.
Field names must be unique within a given tracepoint definition.
Here’s a complete tracepoint definition example:
Example:Tracepoint definition.
The following tracepoint definition defines a tracepoint which takes
three input arguments and has four output event fields.
Note:The LTTng-UST tracer only evaluates the arguments of a tracepoint
at run time when such a tracepoint could emit an event. See
this note to learn more.
A tracepoint class is a class of tracepoints which share the same
output event field definitions. A tracepoint instance is one
instance of such a defined tracepoint class, with its own tracepoint
name.
The LTTNG_UST_TRACEPOINT_EVENT() macro is
actually a shorthand which defines both a tracepoint class and a
tracepoint instance at the same time.
When you build a tracepoint provider package, the C or C++ compiler
creates one serialization function for each tracepoint class. A
serialization function is responsible for serializing the event fields
of a tracepoint to a sub-buffer when recording.
For various performance reasons, when your situation requires multiple
tracepoint definitions with different names, but with the same event
fields, we recommend that you manually create a tracepoint class and
instantiate as many tracepoint instances as needed. One positive effect
of such a design, amongst other advantages, is that all tracepoint
instances of the same tracepoint class reuse the same serialization
function, thus reducing
cache pollution.
Example:Use a tracepoint class and tracepoint instances.
Consider the following three tracepoint definitions:
In this case, we create three tracepoint classes, with one implicit
tracepoint instance for each of them: get_account, get_settings, and
get_transaction. However, they all share the same event field names
and types. Hence three identical, yet independent serialization
functions are created when you build the tracepoint provider package.
A better design choice is to define a single tracepoint class and three
tracepoint instances:
/* The tracepoint class */LTTNG_UST_TRACEPOINT_EVENT_CLASS(/* Tracepoint class provider name */my_app,/* Tracepoint class name */my_class,/* Input arguments */LTTNG_UST_TP_ARGS(int,userid,size_t,len),/* Output event fields */LTTNG_UST_TP_FIELDS(lttng_ust_field_integer(int,userid,userid)lttng_ust_field_integer(size_t,len,len)))/* The tracepoint instances */LTTNG_UST_TRACEPOINT_EVENT_INSTANCE(/* Tracepoint class provider name */my_app,/* Tracepoint class name */my_class,/* Instance provider name */my_app,/* Tracepoint name */get_account,/* Input arguments */LTTNG_UST_TP_ARGS(int,userid,size_t,len))LTTNG_UST_TRACEPOINT_EVENT_INSTANCE(my_app,my_class,get_settings,LTTNG_UST_TP_ARGS(int,userid,size_t,len))LTTNG_UST_TRACEPOINT_EVENT_INSTANCE(my_app,my_class,get_transaction,LTTNG_UST_TP_ARGS(int,userid,size_t,len))
The tracepoint class and instance provider names must be the same if the
LTTNG_UST_TRACEPOINT_EVENT_CLASS() and
LTTNG_UST_TRACEPOINT_EVENT_INSTANCE() expansions are part of the same
translation unit. See lttng-ust(3) to learn more.
Assign a log level to a tracepoint definition
with the LTTNG_UST_TRACEPOINT_LOGLEVEL() macro.
Assigning different levels of severity to tracepoint definitions can be
useful: when you create a recording event rule, you can target tracepoints having a log level at least as severe
as a specific value.
The concept of LTTng-UST log levels is similar to the levels found
in typical logging frameworks:
In a logging framework, the log level is given by the function
or method name you use at the log statement site: debug(),
info(), warn(), error(), and so on.
In LTTng-UST, you statically assign the log level to a tracepoint
definition; any lttng_ust_tracepoint() macro invocation which refers
to this definition has this log level.
A tracepoint provider package source file is a C source file which
includes a tracepoint provider header file to expand its
macros into event serialization and other functions.
Use the following tracepoint provider package source file template:
Replace tp.h with the name of your tracepoint provider header file name. You may also include more than one tracepoint
provider header file here to create a tracepoint provider package
holding more than one tracepoint providers.
The lttng_ust_tracepoint() macro takes at least two parameters: the
tracepoint provider name and the tracepoint name. The corresponding
tracepoint definition defines the other parameters.
Example:lttng_ust_tracepoint() usage.
The following tracepoint definition defines a
tracepoint which takes two input arguments and has two output event
fields.
Note how the source code of the application includes
the tracepoint provider header file containing the tracepoint
definitions to use, tp.h.
Example:lttng_ust_tracepoint() usage with a complex tracepoint definition.
Consider this complex tracepoint definition, where multiple event
fields refer to the same input arguments in their argument expression
parameter:
Tracepoint provider header file.
/* For `struct stat` */#include<sys/types.h>#include<sys/stat.h>#include<unistd.h>LTTNG_UST_TRACEPOINT_EVENT(my_provider,my_tracepoint,LTTNG_UST_TP_ARGS(int,my_int_arg,char*,my_str_arg,structstat*,st),LTTNG_UST_TP_FIELDS(lttng_ust_field_integer(int,my_constant_field,23+17)lttng_ust_field_integer(int,my_int_arg_field,my_int_arg)lttng_ust_field_integer(int,my_int_arg_field2,my_int_arg*my_int_arg)lttng_ust_field_integer(int,sum4_field,my_str_arg[0]+my_str_arg[1]+my_str_arg[2]+my_str_arg[3])lttng_ust_field_string(my_str_arg_field,my_str_arg)lttng_ust_field_integer_hex(off_t,size_field,st->st_size)lttng_ust_field_float(double,size_dbl_field,(double)st->st_size)lttng_ust_field_sequence_text(char,half_my_str_arg_field,my_str_arg,size_t,strlen(my_str_arg)/2)))
Refer to this tracepoint definition with the lttng_ust_tracepoint()
macro in the source code of your application like this:
If you look at the event record that LTTng writes when recording this
program, assuming the file size of /etc/fstab is 301 bytes,
it should look like this:
Event record fields
Field name
Field value
my_constant_field
40
my_int_arg_field
23
my_int_arg_field2
529
sum4_field
389
my_str_arg_field
Hello, World!
size_field
0x12d
size_dbl_field
301.0
half_my_str_arg_field
Hello,
Sometimes, the arguments you pass to lttng_ust_tracepoint() are
expensive to evaluate—they use the call stack, for example. To avoid
this computation when LTTng wouldn’t emit any event anyway, use the
lttng_ust_tracepoint_enabled() and lttng_ust_do_tracepoint() macros.
The syntax of the lttng_ust_tracepoint_enabled() and
lttng_ust_do_tracepoint() macros is:
lttng_ust_tracepoint_enabled() and lttng_ust_do_tracepoint() macros syntax.
lttng_ust_tracepoint_enabled() returns a non-zero value if executing
the tracepoint named tracepoint_name from the provider named
provider_namecould make LTTng emit an event, depending on the
payload of said event.
lttng_ust_do_tracepoint() is like lttng_ust_tracepoint(), except
that it doesn’t check what lttng_ust_tracepoint_enabled() checks.
Using lttng_ust_tracepoint() with lttng_ust_tracepoint_enabled() is
dangerous because lttng_ust_tracepoint() also contains the
lttng_ust_tracepoint_enabled() check; therefore, a race condition is
possible in this situation:
Possible race condition when using lttng_ust_tracepoint_enabled() with lttng_ust_tracepoint().
If lttng_ust_tracepoint_enabled() is false, but would be true after
the conditional block, then stuff isn’t prepared: the emitted event
will either contain wrong data, or the whole application could crash
(with a segmentation fault, for example).
Note:Neither lttng_ust_tracepoint_enabled() nor
lttng_ust_do_tracepoint() have an STAP_PROBEV() call. If you need
it, you must emit this call yourself.
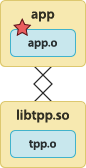
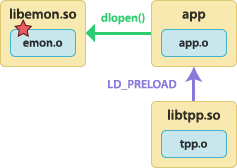
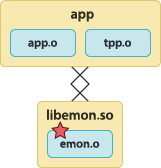
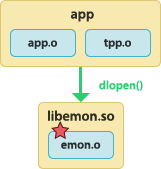
Once you have one or more tracepoint provider header files and a tracepoint provider package source file,
create the tracepoint provider package by compiling its source
file. From here, multiple build and run scenarios are possible. The
following table shows common application and library configurations
along with the required command lines to achieve them.
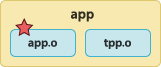
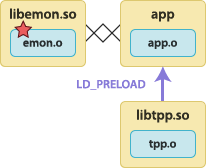
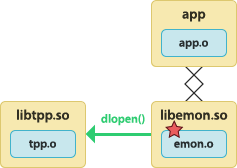
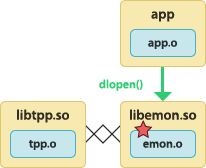
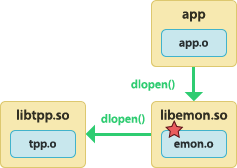
In the following diagrams, we use the following file names:
app
Executable application.
app.o
Application object file.
tpp.o
Tracepoint provider package object file.
tpp.a
Tracepoint provider package archive file.
libtpp.so
Tracepoint provider package shared object file.
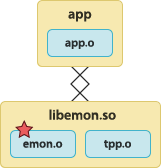
emon.o
User library object file.
libemon.so
User library shared object file.
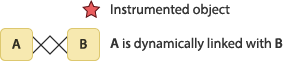
We use the following symbols in the diagrams of table below:
Symbols used in the build scenario diagrams.
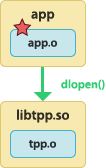
We assume that . is part of the LD_LIBRARY_PATH environment
variable in the following instructions.
Common tracepoint provider package scenarios.
Scenario
Instructions
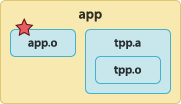
The instrumented application is statically linked with
the tracepoint provider package object.
To build the tracepoint provider package object file:
The --export-dynamic option passed to the linker is necessary for the
dynamically loaded library to “see” the tracepoint symbols defined in
the application.
If your instrumented application calls fork(2), clone(2),
or BSD’s rfork(2), without a following exec(3)-family
system call, you must preload the liblttng-ust-fork.so shared
object when you start the application.
$
LD_PRELOAD=liblttng-ust-fork.so ./my-app
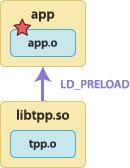
If your tracepoint provider package is
a shared library which you also preload, you must put both
shared objects in LD_PRELOAD:
If your instrumented application closes one or more file descriptors
which it did not open itself, you must preload the
liblttng-ust-fd.so shared object when you start the application:
$
LD_PRELOAD=liblttng-ust-fd.so ./my-app
Typical use cases include closing all the file descriptors after
fork(2) or rfork(2) and buggy applications doing
“double closes”.
On some distributions, LTTng-UST ships with a
pkg-config
metadata file. If this is your case, then use pkg-config to
build an application on the command line:
In order to trace a 32-bit application running on a 64-bit system,
LTTng must use a dedicated 32-bit
consumer daemon.
The following steps show how to build and install a 32-bit consumer
daemon, which is not part of the default 64-bit LTTng build, how to
build and install the 32-bit LTTng-UST libraries, and how to build and
link an instrumented 32-bit application in that context.
To build a 32-bit instrumented application for a 64-bit target system,
assuming you have a fresh target system with no installed Userspace RCU
or LTTng packages:
Download, build, and install a 32-bit version of Userspace RCU:
$
cd $(mktemp -d) &&
wget https://lttng.org/files/urcu/userspace-rcu-latest-0.13.tar.bz2 &&
tar -xf userspace-rcu-latest-0.13.tar.bz2 &&
cd userspace-rcu-0.13.* &&
./configure --libdir=/usr/local/lib32 CFLAGS=-m32 &&
make &&
sudo make install &&
sudo ldconfig
Using the package manager of your distribution, or from source,
install the 32-bit versions of the following dependencies of
LTTng-tools and LTTng-UST:
Download, build, and install a 32-bit version of the latest
LTTng-UST 2.13:
$
cd $(mktemp -d) &&
wget https://lttng.org/files/lttng-ust/lttng-ust-latest-2.13.tar.bz2 &&
tar -xf lttng-ust-latest-2.13.tar.bz2 &&
cd lttng-ust-2.13.* &&
./configure --libdir=/usr/local/lib32 \
            CFLAGS=-m32 CXXFLAGS=-m32 \
            LDFLAGS='-L/usr/local/lib32 -L/usr/lib32' &&
make &&
sudo make install &&
sudo ldconfig
Add --disable-numa to ./configure if you don’t have
numactl.
Note:Depending on your distribution, 32-bit libraries could be installed at a
different location than /usr/lib32. For example, Debian is known to
install some 32-bit libraries in /usr/lib/i386-linux-gnu.
In this case, make sure to set LDFLAGS to all the
relevant 32-bit library paths, for example:
$
LDFLAGS='-L/usr/lib/i386-linux-gnu -L/usr/lib32'
Download the latest LTTng-tools 2.13, build, and install
the 32-bit consumer daemon:
$
cd $(mktemp -d) &&
wget https://lttng.org/files/lttng-tools/lttng-tools-latest-2.13.tar.bz2 &&
tar -xf lttng-tools-latest-2.13.tar.bz2 &&
cd lttng-tools-2.13.* &&
./configure --libdir=/usr/local/lib32 CFLAGS=-m32 CXXFLAGS=-m32 \
            LDFLAGS='-L/usr/local/lib32 -L/usr/lib32' \
            --disable-bin-lttng --disable-bin-lttng-crash \
            --disable-bin-lttng-relayd --disable-bin-lttng-sessiond &&
make &&
cd src/bin/lttng-consumerd &&
sudo make install &&
sudo ldconfig
From your distribution or from source, install
the 64-bit versions of LTTng-UST and Userspace RCU.
Download, build, and install the 64-bit version of the
latest LTTng-tools 2.13:
$
cd $(mktemp -d) &&
wget https://lttng.org/files/lttng-tools/lttng-tools-latest-2.13.tar.bz2 &&
tar -xf lttng-tools-latest-2.13.tar.bz2 &&
cd lttng-tools-2.13.* &&
./configure --with-consumerd32-libdir=/usr/local/lib32 \
            --with-consumerd32-bin=/usr/local/lib32/lttng/libexec/lttng-consumerd &&
make &&
sudo make install &&
sudo ldconfig
Pass the following options to gcc(1), g++(1), or clang(1)
when linking your 32-bit application:
Important:The lttng_ust_tracef() utility function was developed to make user
space tracing super simple, albeit with notable disadvantages compared
to user-defined tracepoints:
All the created events have the same tracepoint provider and
tracepoint names, respectively lttng_ust_tracef and event.
There’s no static type checking.
The only event record field you actually get, named msg, is a string
potentially containing the values you passed to lttng_ust_tracef()
using your own format string. This also means that you can’t filter
events with a custom expression at run time because there are no
isolated fields.
Since lttng_ust_tracef() uses the vasprintf(3) function of the
C standard library behind the scenes to format the strings at run
time, its expected performance is lower than with user-defined
tracepoints, which don’t require a conversion to a string.
Taking this into consideration, lttng_ust_tracef() is useful for some
quick prototyping and debugging, but you shouldn’t consider it for any
permanent and serious applicative instrumentation.
The liblttng-ust-libc-wrapper.so and
liblttng-ust-pthread-wrapper.so helpers
add instrumentation to some C standard library and POSIX
threads functions.
Functions instrumented by preloading liblttng-ust-libc-wrapper.so.
When you preload the shared object, it replaces the functions listed
in the previous tables by wrappers which contain tracepoints and call
the replaced functions.
The liblttng-ust-cyg-profile*.so helpers can add instrumentation
to the entry and exit points of functions.
gcc(1) and clang(1) have an option named
-finstrument-functions
which generates instrumentation calls for entry and exit to functions.
The LTTng-UST function tracing helpers,
liblttng-ust-cyg-profile.so and
liblttng-ust-cyg-profile-fast.so, take advantage of this feature
to add tracepoints to the two generated functions (which contain
cyg_profile in their names, hence the name of the helper).
To use the LTTng-UST function tracing helper, the source files to
instrument must be built using the -finstrument-functions compiler
flag.
There are two versions of the LTTng-UST function tracing helper:
liblttng-ust-cyg-profile-fast.so is a lightweight variant
that you should only use when it can be guaranteed that the
complete event stream is recorded without any lost event record.
Any kind of duplicate information is left out.
Assuming no event record is lost, having only the function addresses on
entry is enough to create a call graph, since an event record always
contains the ID of the CPU that generated it.
Use a tool like addr2line(1) to convert function addresses back to
source file names and line numbers.
liblttng-ust-cyg-profile.so is a more robust variant
which also works in use cases where event records might get discarded or
not recorded from application startup.
In these cases, the trace analyzer needs more information to be
able to reconstruct the program flow.
All the tracepoints that this helper provides have the log level
LTTNG_UST_TRACEPOINT_LOGLEVEL_DEBUG_FUNCTION (see lttng-ust(3)).
Tip:It’s sometimes a good idea to limit the number of source files that
you compile with the -finstrument-functions option to prevent LTTng
from writing an excessive amount of trace data at run time. When using
gcc(1), use the
-finstrument-functions-exclude-function-list option to avoid
instrument entries and exits of specific function names.
Apache log4j 1.2, since
LTTng 2.6. Note that Apache Log4j 2 isn’t supported.
LTTng-UST Java agent imported by a Java application.
Note that the methods described below are new in LTTng 2.8.
Previous LTTng versions use another technique.
Note:We use OpenJDK 8 for development
and continuous integration, thus this version is
directly supported. However, the LTTng-UST Java agent is also tested
with OpenJDK 7.
This isn’t strictly necessary, but it’s recommended for a clean
disposal of the resources of the handler.
Include the common and JUL-specific JAR files of the LTTng-UST Java agent,
lttng-ust-agent-common.jar and lttng-ust-agent-jul.jar,
in the
class
path when you build the Java application.
The JAR files are typically located in /usr/share/java.
Important:The LTTng-UST Java agent must be
installed for the logging framework your
application uses.
Example:Use the LTTng-UST Java agent for java.util.logging.
Test.java
importjava.io.IOException;importjava.util.logging.Handler;importjava.util.logging.Logger;importorg.lttng.ust.agent.jul.LttngLogHandler;publicclassTest{privatestaticfinalintanswer=42;publicstaticvoidmain(String[]argv)throwsException{// Create a loggerLoggerlogger=Logger.getLogger("jello");// Create an LTTng-UST log handlerHandlerlttngUstLogHandler=newLttngLogHandler();// Add the LTTng-UST log handler to our loggerlogger.addHandler(lttngUstLogHandler);// Log at will!logger.info("some info");logger.warning("some warning");Thread.sleep(500);logger.finer("finer information; the answer is "+answer);Thread.sleep(123);logger.severe("error!");// Not mandatory, but cleanerlogger.removeHandler(lttngUstLogHandler);lttngUstLogHandler.close();}}
In the resulting trace, an event record which a Java
application using java.util.logging generated is named
lttng_jul:event and has the following fields:
msg
Log record message.
logger_name
Logger name.
class_name
Name of the class in which the log statement was executed.
method_name
Name of the method in which the log statement was executed.
long_millis
Logging time (timestamp in milliseconds).
int_loglevel
Log level integer value.
int_threadid
ID of the thread in which the log statement was executed.
This isn’t strictly necessary, but it’s recommended for a clean
disposal of the resources of the appender.
Include the common and log4j-specific JAR
files of the LTTng-UST Java agent, lttng-ust-agent-common.jar and
lttng-ust-agent-log4j.jar, in the
class
path when you build the Java application.
The JAR files are typically located in /usr/share/java.
Important:The LTTng-UST Java agent must be
installed for the logging framework your
application uses.
Example:Use the LTTng-UST Java agent for Apache log4j.
Test.java
importorg.apache.log4j.Appender;importorg.apache.log4j.Logger;importorg.lttng.ust.agent.log4j.LttngLogAppender;publicclassTest{privatestaticfinalintanswer=42;publicstaticvoidmain(String[]argv)throwsException{// Create a loggerLoggerlogger=Logger.getLogger("jello");// Create an LTTng-UST log appenderAppenderlttngUstLogAppender=newLttngLogAppender();// Add the LTTng-UST log appender to our loggerlogger.addAppender(lttngUstLogAppender);// Log at will!logger.info("some info");logger.warn("some warning");Thread.sleep(500);logger.debug("debug information; the answer is "+answer);Thread.sleep(123);logger.fatal("error!");// Not mandatory, but cleanerlogger.removeAppender(lttngUstLogAppender);lttngUstLogAppender.close();}}
Build this example ($LOG4JPATH is the path to the Apache log4j JAR
file):
A Java application-specific context field is a piece of state which
the Java application provides. You can add such
a context field to be recorded, using the
lttng-add-context(1) command, to each event record
which the log statements of this application produce.
For example, a given object might have a current request ID variable.
You can create a context information retriever for this object and
assign a name to this current request ID. You can then, using the
lttng-add-context(1) command, add this context field by name so that
LTTng writes it to the event records of a given java.util.logging or
log4j channel.
To provide application-specific context fields in a Java application:
In the source code of the Java application, import the LTTng-UST
Java agent context classes and interfaces:
This retrieveContextInfo() method is the only member of the
IContextInfoRetriever interface. Its role is to return the current
value of a state by name to create a context field. The names of the
context fields and which state variables they return depends on your
specific scenario.
All primitive types and objects are supported as context fields.
When retrieveContextInfo() returns an object, the context field
serializer calls its toString() method to add a string field to
event records. The method can also return null, which means that
no context field is available for the required name.
Register an instance of your context information retriever class to
the context information manager singleton:
This isn’t strictly necessary, but it’s recommended for a clean
disposal of some resources of the manager.
Build your Java application with LTTng-UST Java agent support as
usual, following the procedure for either the
java.util.logging or Apache log4j framework.
Example:Provide application-specific context fields in a Java application.
Test.java
importjava.util.logging.Handler;importjava.util.logging.Logger;importorg.lttng.ust.agent.jul.LttngLogHandler;importorg.lttng.ust.agent.context.ContextInfoManager;importorg.lttng.ust.agent.context.IContextInfoRetriever;publicclassTest{// Our context information retriever classprivatestaticclassMyContextInfoRetrieverimplementsIContextInfoRetriever{@OverridepublicObjectretrieveContextInfo(Stringkey){if(key.equals("intCtx")){return(short)17;}elseif(key.equals("strContext")){return"context value!";}else{returnnull;}}}privatestaticfinalintanswer=42;publicstaticvoidmain(Stringargs[])throwsException{// Get the context information manager instanceContextInfoManagercim=ContextInfoManager.getInstance();// Create and register our context information retrieverIContextInfoRetrievercir=newMyContextInfoRetriever();cim.registerContextInfoRetriever("myRetriever",cir);// Create a loggerLoggerlogger=Logger.getLogger("jello");// Create an LTTng-UST log handlerHandlerlttngUstLogHandler=newLttngLogHandler();// Add the LTTng-UST log handler to our loggerlogger.addHandler(lttngUstLogHandler);// Log at will!logger.info("some info");logger.warning("some warning");Thread.sleep(500);logger.finer("finer information; the answer is "+answer);Thread.sleep(123);logger.severe("error!");// Not mandatory, but cleanerlogger.removeHandler(lttngUstLogHandler);lttngUstLogHandler.close();cim.unregisterContextInfoRetriever("myRetriever");}}
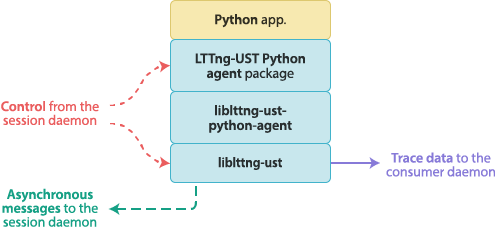
You can instrument a Python 2 or Python 3 application which
uses the standard
logging package.
Each log statement creates an LTTng event once the application module
imports the LTTng-UST Python agent package.
A Python application importing the LTTng-UST Python agent.
To use the LTTng-UST Python agent:
In the source code of the Python application, import the LTTng-UST
Python agent:
importlttngust
The LTTng-UST Python agent automatically adds its logging handler to the
root logger at import time.
A log statement that the application executes before this import doesn’t
create an LTTng event.
Important:The LTTng-UST Python agent must be
installed.
Use log statements and logging configuration as usual.
Since the LTTng-UST Python agent adds a handler to the root
logger, any log statement from any logger can emit an LTTng event.
Note:logging.basicConfig(), which adds to the root logger a basic
logging handler which prints to the standard error stream, isn’t
strictly required for LTTng-UST tracing to work, but in versions of
Python preceding 3.2, you could see a warning message which
indicates that no handler exists for the logger my-logger.
When an application imports the LTTng-UST Python agent, the agent tries
to register to a session daemon. Note that you must
start the session daemonbefore you run the Python
application. If a session daemon is found, the agent tries to register
to it during five seconds, after which the application continues
without LTTng tracing support. Override this timeout value with
the LTTNG_UST_PYTHON_REGISTER_TIMEOUT environment variable
(milliseconds).
If the session daemon stops while a Python application with an imported
LTTng-UST Python agent runs, the agent retries to connect and to
register to a session daemon every three seconds. Override this
delay with the LTTNG_UST_PYTHON_REGISTER_RETRY_DELAY environment
variable.
The lttng-tracer Linux kernel module, part of
LTTng-modules, creates the special LTTng logger files
/proc/lttng-logger and /dev/lttng-logger (since
LTTng 2.11) when it’s loaded. Any application can write text data
to any of those files to create one or more LTTng events.
An application writes to the LTTng logger file to create one or more LTTng events.
The LTTng logger is the quickest method—not the most efficient,
however—to add instrumentation to an application. It’s designed
mostly to instrument shell scripts:
$
echo "Some message, some $variable" > /dev/lttng-logger
Any event that the LTTng logger creates is named lttng_logger and
belongs to the Linux kernel tracing domain. However, unlike
other instrumentation points in the kernel tracing domain, any Unix
user can create a recording event rule
which matches events named lttng_logger, not only the root user or
users in the tracing group.
To use the LTTng logger:
From any application, write text data to the /dev/lttng-logger
file.
The msg field of lttng_logger event records contains the
recorded message.
Note:The maximum message length of an LTTng logger event is
1024 bytes. Writing more than this makes the LTTng logger emit more
than one event to contain the remaining data.
You shouldn’t use the LTTng logger to trace a user application which you
can instrument in a more efficient way, namely:
Note:This section shows how to add instrumentation points to the
Linux kernel. The subsystems of the kernel are already thoroughly
instrumented at strategic points for LTTng when you
install the LTTng-modules
package.
The following procedure assumes that your ftrace tracepoints are
correctly defined in their own header and that they’re created in
one source file using the CREATE_TRACE_POINTS definition.
To add an LTTng layer over an existing ftrace tracepoint:
Make sure the following kernel configuration options are
enabled:
CONFIG_MODULES
CONFIG_KALLSYMS
CONFIG_HIGH_RES_TIMERS
CONFIG_TRACEPOINTS
Build the Linux source tree with your custom ftrace tracepoints.
Boot the resulting Linux image on your target system.
Confirm that the tracepoints exist by looking for their names in the
/sys/kernel/debug/tracing/events/subsys directory, where subsys
is your subsystem name.
Get a copy of the latest LTTng-modules 2.13:
$
cd $(mktemp -d) &&
wget https://lttng.org/files/lttng-modules/lttng-modules-latest-2.13.tar.bz2 &&
tar -xf lttng-modules-latest-2.13.tar.bz2 &&
cd lttng-modules-2.13.*
In instrumentation/events/lttng-module, relative to the root
of the LTTng-modules source tree, create a header file named
subsys.h for your custom subsystem subsys and write your
LTTng-modules tracepoint definitions using the LTTng-modules
macros in it.
Start with this template:
instrumentation/events/lttng-module/my_subsys.h
#undef TRACE_SYSTEM#define TRACE_SYSTEM my_subsys#if !defined(_LTTNG_MY_SUBSYS_H) || defined(TRACE_HEADER_MULTI_READ)#define _LTTNG_MY_SUBSYS_H#include"../../../probes/lttng-tracepoint-event.h"#include<linux/tracepoint.h>LTTNG_TRACEPOINT_EVENT(/* * Format is identical to the TRACE_EVENT() version for the three * following macro parameters: */my_subsys_my_event,TP_PROTO(intmy_int,constchar*my_string),TP_ARGS(my_int,my_string),/* LTTng-modules specific macros */TP_FIELDS(ctf_integer(int,my_int_field,my_int)ctf_string(my_bar_field,my_bar)))#endif /* !defined(_LTTNG_MY_SUBSYS_H) || defined(TRACE_HEADER_MULTI_READ) */#include"../../../probes/define_trace.h"
The entries in the TP_FIELDS() section are the list of fields for the
LTTng tracepoint. This is similar to the TP_STRUCT__entry() part of
the TRACE_EVENT() ftrace macro.
make KERNELDIR=/path/to/linux
make modules_install && depmod -a
Replace /path/to/linux with the path to the Linux source tree where
you defined and used tracepoints with the TRACE_EVENT() ftrace macro.
Note that you can also use the
LTTNG_TRACEPOINT_EVENT_CODE() macro
instead of LTTNG_TRACEPOINT_EVENT() to use custom local variables and
C code that need to be executed before LTTng records the event
fields.
The best way to learn how to use the previous LTTng-modules macros is to
inspect the existing LTTng-modules tracepoint definitions in the
instrumentation/events/lttng-module header files. Compare them
with the Linux kernel mainline versions in the
include/trace/events directory of the Linux source tree.
Although we recommended to always use the
LTTNG_TRACEPOINT_EVENT() macro to describe
the arguments and fields of an LTTng-modules tracepoint when possible,
sometimes you need a more complex process to access the data that the
tracer records as event record fields. In other words, you need local
variables and multiple C statements instead of simple
argument-based expressions that you pass to the
ctf_*() macros of TP_FIELDS().
Use the LTTNG_TRACEPOINT_EVENT_CODE() macro instead of
LTTNG_TRACEPOINT_EVENT() to declare custom local variables and define
a block of C code to be executed before LTTng records the fields.
The structure of this macro is:
LTTNG_TRACEPOINT_EVENT_CODE() macro syntax.
LTTNG_TRACEPOINT_EVENT_CODE(/* * Format identical to the LTTNG_TRACEPOINT_EVENT() * version for the following three macro parameters: */my_subsys_my_event,TP_PROTO(intmy_int,constchar*my_string),TP_ARGS(my_int,my_string),/* Declarations of custom local variables */TP_locvar(inta=0;unsignedlongb=0;constchar*name="(undefined)";structmy_struct*my_struct;),/* * Custom code which uses both tracepoint arguments * (in TP_ARGS()) and local variables (in TP_locvar()). * * Local variables are actually members of a structure pointed * to by the special variable tp_locvar. */TP_code(if(my_int){tp_locvar->a=my_int+17;tp_locvar->my_struct=get_my_struct_at(tp_locvar->a);tp_locvar->b=my_struct_compute_b(tp_locvar->my_struct);tp_locvar->name=my_struct_get_name(tp_locvar->my_struct);put_my_struct(tp_locvar->my_struct);if(tp_locvar->b){tp_locvar->a=1;}}),/* * Format identical to the LTTNG_TRACEPOINT_EVENT() * version for this, except that tp_locvar members can be * used in the argument expression parameters of * the ctf_*() macros. */TP_FIELDS(ctf_integer(unsignedlong,my_struct_b,tp_locvar->b)ctf_integer(int,my_struct_a,tp_locvar->a)ctf_string(my_string_field,my_string)ctf_string(my_struct_name,tp_locvar->name)))
Important:The C code defined in TP_code() must not have any side
effects when executed. In particular, the code must not allocate
memory or get resources without deallocating this memory or putting
those resources afterwards.
Note:In the following subsections, we refer to an lttng(1) command
using its man page name. For example, instead of “Run the create
command to”, we write “Run the lttng-create(1) command to”.
You will see the following error when you run a command while no session
daemon is running:
Error: No session daemon is available
The only command that automatically runs a session daemon is
lttng-create(1), which you use to
create a recording session. While
this could be your most used first operation, sometimes it’s not. Some
examples are:
All the examples above don’t require a recording session to operate on.
Each Unix user can have its own running session daemon
to use the user space LTTng tracer. The session daemon that the root
user starts is the only one allowed to control the LTTng kernel tracer.
Members of the Unix tracing group may connect to and control the root
session daemon, even for user space tracing. See the “Session daemon
connection” section of lttng(1) to learn more about the Unix
tracing group.
In both cases, remove the --daemonize option to
start the session daemon in foreground.
To stop a session daemon, kill its process (see kill(1)) with the
standard TERM signal.
Note that some Linux distributions could manage the LTTng session daemon
as a service. In this case, we suggest that you use the service manager
to start, restart, and stop session daemons.
Replace SESSION with your specific recording session name.
In local mode, LTTng writes the traces of a recording
session to the $LTTNG_HOME/lttng-traces/NAME-DATE-TIME
directory by default, where NAME is the name of the recording
session. Note that the LTTNG_HOME environment variable defaults to
$HOME if not set.
When you create a recording session, the
lttng-create(1) command sets it as the current recording session.
The following lttng(1) commands operate on the current recording
session when you don’t specify one:
Replace SESSION with the name of the new current recording session.
When you’re done recording in a given recording session, destroy it.
This operation frees the resources taken by the recording session to
destroy; it doesn’t destroy the trace data that LTTng wrote for this
recording session (see “Clear a recording session” for one
way to do this).
The lttng-enable-event(1) command always attaches an event rule to a
channel on creation. The command can create a default
channel, named channel0, for you. The lttng-enable-event(1)
command reuses the default channel each time you run it for the same
tracing domain and session.
A recording event rule is always enabled at creation time.
The following examples show how to combine the command-line arguments of
the lttng-enable-event(1) command to create simple to more complex
recording event rules within the current recording session.
Example:Create a recording event rule matching specific Linux kernel tracepoint events (default channel).
#
lttng enable-event --kernel sched_switch
Example:Create a recording event rule matching Linux kernel system call events with four specific names (default channel).
The recording event rules of a given channel form a whitelist: as soon
as an event rule matches an event, LTTng emits it once and therefore
can record it. For example,
the following rules both match user space tracepoint events named
my_app:my_tracepoint with an INFO log level:
lttng-disable-event(1) can only find recording event rules to
disable by their instrumentation point type and event name conditions. Therefore, you cannot disable
recording event rules having a specific instrumentation point log level
condition, for example.
LTTng doesn’t emit (and, therefore, won’t record) an event which only
disabled recording event rules match.
Example:Disable event rules matching Python logging events from the my-logger logger (default channel, current recording session).
Example:Disable all the Linux kernel recording event rules (channel my-chan, current recording session).
The --all-events option isn’t, like the
--all option of the lttng-enable-event(1)
command, an alias for the event name globbing pattern *: it disables
all the recording event rules of a given channel.
LTTng is flexible: you can launch user applications before or after you
start the tracers. An LTTng tracer only records an event if a
recording event rule matches it, which means the tracer is active.
The start-sessiontrigger action can also start a recording
session.
You might need to remove all the current tracing data of one or more
recording sessions between multiple attempts to
reproduce a problem without interrupting the LTTng recording activity.
Note that LTTng can automatically create a default channel when you
create a recording event rule.
Therefore, you only need to create a channel when you need non-default
attributes.
Specify each non-default channel attribute with a command-line
option when you run the lttng-enable-channel(1) command.
You can only create a custom channel in the Linux kernel and user space
tracing domains: the Java/Python logging tracing domains have
their own default channel which LTTng automatically creates when you
create a recording event rule.
Important:As of LTTng 2.13, you may not perform the
following operations with the lttng-enable-channel(1) command:
Change an attribute of an existing channel.
Enable a disabled channel once its recording session has been
active at least once.
Create a channel once its recording session has been active at
least once.
Create a user space channel with a given
buffering scheme and create a second
user space channel with a different buffering scheme in the same
recording session.
When a CPU executes the app:tpuser space tracepoint, the two recording event rules above match the created
event, making LTTng emit the event. Because the recording event rules
are not attached to the same channel, LTTng records the event twice.
Event record fields in trace files provide important
information about previously emitted events, but sometimes some external
context may help you solve a problem faster.
Examples of context fields are:
The process ID, thread ID, process name, and
process priority of the thread from which LTTng emits the event.
The hostname of the system on which LTTng emits the event.
The Linux kernel and user call stacks (since LTTng 2.11).
The current values of many possible performance counters using
perf, for example:
CPU cycles, stalled cycles, idle cycles, and the other cycle types.
Cache misses.
Branch instructions, misses, and loads.
CPU faults.
Any state defined at the application level (supported for the
java.util.logging and Apache log4j tracing domains).
The following command line adds the virtual process identifier and the
per-thread CPU cycles count fields to all the user space channels of the
current recording session.
Example:Add context fields to be recorded to the event records of a specific channel.
The following command line adds the thread identifier and user call
stack context fields to the Linux kernel channel named my-channel of
the current recording session.
The following command line makes sure LTTng writes the cur_msg_id
context field of the retriever context retriever to all the Java
logging event records of the channel named my-channel:
It’s often useful to only allow processes with specific attributes to
record events. For example, you may wish to record all the system calls
which a given process makes (à la strace(1)).
The lttng-track(1) and lttng-untrack(1) commands serve this
purpose. Both commands operate on inclusion sets of process
attributes. The available process attribute types are:
A recording session has nine process
attribute inclusion sets: six for the Linux kernel tracing domain
and three for the user space tracing domain.
For a given recording session, a process P is allowed to record
LTTng events for a given tracing domainD if all
the attributes of P are part of the inclusion sets
of D.
Whether a process is allowed or not to record LTTng events is an
implicit condition of all recording event rules. Therefore, if
LTTng creates an event E for a given process, but this process
may not record events, then no recording event rule matches E,
which means LTTng won’t emit and record E.
When you create a recording session, all its process attribute inclusion sets contain all the
possible values. In other words, all processes are allowed to record
events.
Should a process with a given ID (part of an inclusion set), for
example, exit, and then a new process be given this same ID, then the
latter would also be allowed to record events.
With the lttng-track(1) command, you can add Unix user and group
names to the user and group inclusion sets: the
session daemon finds the corresponding UID, VUID,
GID, or VGID once on addition to the inclusion set. This means that if
you rename the user or group after you run the lttng-track(1)
command, its user/group ID remains part of the inclusion sets.
Example:Allow processes to record events based on their virtual process ID (VPID).
For the sake of the following example, assume the target system has
16 possible VPIDs.
When the inclusion set is full and you run the lttng-track(1)
command to specify some VPIDs, LTTng:
Clears the inclusion set.
Adds the specific VPIDs to the inclusion set.
After:
$
lttng track --userspace --vpid=3,4,7,10,13
the VPID inclusion set is:
The VPID inclusion set contains the VPIDs 3, 4, 7, 10, and 13.
Add more VPIDs to the inclusion set afterwards:
$
lttng track --userspace --vpid=1,15,16
The result is:
VPIDs 1, 15, and 16 are added to the inclusion set.
The lttng-untrack(1) command removes entries from process attribute
inclusion sets. Given the previous example, the following command:
$
lttng untrack --userspace --vpid=3,7,10,13
leads to this VPID inclusion set:
VPIDs 3, 7, 10, and 13 are removed from the inclusion set.
You can make the VPID inclusion set full again with the
--all option:
$
lttng track --userspace --vpid --all
The result is, again:
The VPID inclusion set is full.
Example:Allow specific processes to record events based on their user ID (UID).
A typical use case with process attribute inclusion sets is to start
with an empty inclusion set, then start the tracers, and finally add values manually while the tracers are
active.
If the LTTng tracer runs with this inclusion set configuration, it
records no events within the current recording session because no processes is allowed to do so. Use the
lttng-track(1) command as usual to add specific values to the UID
inclusion set when you need to, for example:
#
lttng track --kernel --uid=http,11
Result:
UIDs 6 (http) and 11 are part of the UID inclusion set.
If you use LTTng to solve real world problems, chances are you have to
record events using the same recording session setup over and over,
modifying a few variables each time in your instrumented program or
environment.
To avoid constant recording session reconfiguration, the lttng(1)
command-line tool can save and load recording session configurations
to/from XML files.
Replace SESSION with the name of the recording session to save.
LTTng saves recording session configurations to
$LTTNG_HOME/.lttng/sessions by default. Note that the
LTTNG_HOME environment variable defaults to $HOME if not set. See
lttng-save(1) to learn more about the recording session configuration
output path.
LTTng saves all configuration parameters, for example:
The recording session name.
The trace data output path.
The channels, with their state and all their attributes.
Replace remote-system with the host name or IP address of the
remote system. See lttng-create(1) for the exact URL format.
On the target system, use the lttng(1) command-line tool as usual.
When recording is active, the
consumer daemon of the target sends the contents of
sub-buffers to the remote relay daemon instead of flushing
them to the local file system. The relay daemon writes the received
packets to its local file system.
See the “Output directory” section of lttng-relayd(8) to learn
where a relay daemon writes its received trace data.
LTTng live is a network protocol implemented by the
relay daemon (lttng-relayd(8)) to allow compatible
trace readers to display or analyze event records as LTTng
records events on the target system while recording is
active.
The relay daemon creates a tee: it forwards the trace data to both the
local file system and to connected live readers:
The relay daemon creates a tee, forwarding the trace data to both trace files and a connected live reader.
Replace HOSTNAME with the host name of the target system.
Configure the recording session as usual with the lttng(1)
command-line tool, and start recording.
List the available live recording sessions with babeltrace2(1):
$
babeltrace2 net://localhost
You can start the relay daemon on another system. In this case, you need
to specify the URL of the relay daemon when you
create the recording session with
the --set-url option of the lttng-create(1)
command. You also need to replace localhost in the procedure above
with the host name of the system on which the relay daemon runs.
The normal behavior of LTTng is to append full sub-buffers to growing
trace data files. This is ideal to keep a full history of the events
which the target system emitted, but it can represent too much data in
some situations.
For example, you may wish to have LTTng record your application
continuously until some critical situation happens, in which case you
only need the latest few recorded events to perform the desired
analysis, not multi-gigabyte trace files.
With the lttng-snapshot(1) command, you can take a snapshot of the
current sub-buffers of a given recording session. LTTng can write the snapshot to the local file system or send
it over the network.
A snapshot is a copy of the current sub-buffers, which LTTng does not clear after the operation.
The snapshot feature of LTTng is similar to how a
flight recorder or the
“roll” mode of an oscilloscope work.
Tip:If you wish to create unmanaged, self-contained, non-overlapping
trace chunk archives instead of a simple copy of the current
sub-buffers, see the recording session rotation
feature (available since LTTng 2.11).
Configure the recording session as usual with the lttng(1)
command-line tool, and start recording.
Optional: When you need to take a snapshot,
stop recording.
You can take a snapshot when the tracers are active, but if you stop
them first, you’re guaranteed that the trace data in the sub-buffers
doesn’t change before you actually take the snapshot.
Take a snapshot:
$
lttng snapshot record --name=my-first-snapshot
LTTng writes the current sub-buffers of all the channels of the
current recording session to
trace files on the local file system. Those trace files have
my-first-snapshot in their name.
There’s no difference between the format of a normal trace file and the
format of a snapshot: LTTng trace readers also support LTTng snapshots.
By default, LTTng writes snapshot files to the path shown by
$
lttng snapshot list-output
You can change this path or decide to send snapshots over the network
using either:
The snapshot user guide shows how to dump the
current sub-buffers of a recording session to the file system or send them
over the network. When you take a snapshot, LTTng doesn’t clear the ring
buffers of the recording session: if you take another snapshot immediately
after, both snapshots could contain overlapping trace data.
Inspired by log rotation,
recording session rotation is a feature which appends the content of the
ring buffers to what’s already on the file system or sent over the
network since the creation of the recording session or since the last
rotation, and then clears those ring buffers to avoid trace data
overlaps.
What LTTng is about to write when performing a recording session rotation
is called the current trace chunk. When LTTng writes or sends over the
network this current trace chunk, it becomes a trace chunk archive.
Therefore, a recording session rotation operation archives the current
trace chunk.
A recording session rotation operation archives the current trace chunk.
A trace chunk archive is a self-contained LTTng trace which LTTng
doesn’t manage anymore: you can read it, modify it, move it, or remove
it.
As of LTTng 2.13, there are three methods to perform a
recording session rotation:
When needed, immediately rotate the current recording session:
#
lttng rotate
The lttng-rotate(1) command prints the path to the created trace
chunk archive. See its manual page to learn about the format of trace
chunk archive directory names.
Perform other immediate rotations while the recording session is active.
It’s guaranteed that all the trace chunk archives don’t contain
overlapping trace data. You can also perform an immediate rotation once
you have stopped the recording session.
A trigger associates an LTTng tracing condition to one or more actions:
when the condition is satisfied, LTTng attempts to execute the actions.
A trigger doesn’t need any recording session to exist:
it belongs to a session daemon.
As of LTTng 2.13, many condition types are available through
the liblttng-ctl C API, but the
lttng-add-trigger(1) command only accepts the “event rule matches”
condition.
An “event rule matches” condition is satisfied when its event rule
matches an event.
Unlike a recording event rule, the event rule of an
“event rule matches” trigger condition has no implicit conditions,
that is:
Make sure the pitou recording session is still inactive (stopped):
#
lttng list pitou
The first line should be something like:
Recording session pitou: [inactive]
Run the ls program to fire the LTTng trigger above:
$
ls ~
At this point, the pitou recording session should be active
(started). Confirm this with the lttng-list(1) command again:
#
lttng list pitou
The first line should now look like:
Recording session pitou: [active]
This line confirms that the LTTng trigger you added fired, therefore
starting the pitou recording session.
Example:Send a notification to a user application when an event rule matches.
This example shows how to add the following trigger to the root
session daemon:
Condition
An event rule matches a Linux kernel tracepoint event named
sched_switch and of which the value of the next_comm payload
field is bash.
With such an event rule, LTTng emits an event when Linux gives access to
the processor to a process named bash.
Action
Send an LTTng notification to a user application.
Moreover, we’ll specify a capture descriptor with the
event-rule-matches trigger condition so that the user application can
get the value of a specific sched_switch event payload field.
First, write and build the user application:
Create the C source file of the application:
notif-app.c
#include<stdlib.h>#include<stdio.h>#include<stdbool.h>#include<assert.h>#include<string.h>#include<lttng/lttng.h>/* * Subscribes to notifications, through the notification channel * `notification_channel`, which match the condition of the trigger * named `trigger_name`. * * Returns `true` on success. */staticboolsubscribe(structlttng_notification_channel*notification_channel,constchar*trigger_name){conststructlttng_condition*condition=NULL;structlttng_triggers*triggers=NULL;unsignedinttrigger_count;unsignedinti;enumlttng_error_codeerror_code;enumlttng_trigger_statustrigger_status;boolret=false;/* Get all LTTng triggers */error_code=lttng_list_triggers(&triggers);assert(error_code==LTTNG_OK);/* Get the number of triggers */trigger_status=lttng_triggers_get_count(triggers,&trigger_count);assert(trigger_status==LTTNG_TRIGGER_STATUS_OK);/* Find the trigger named `trigger_name` */for(i=0;i<trigger_count;i++){conststructlttng_trigger*trigger;constchar*this_trigger_name;trigger=lttng_triggers_get_at_index(triggers,i);trigger_status=lttng_trigger_get_name(trigger,&this_trigger_name);assert(trigger_status==LTTNG_TRIGGER_STATUS_OK);if(strcmp(this_trigger_name,trigger_name)==0){/* Trigger found: subscribe with its condition */enumlttng_notification_channel_statusnotification_channel_status;notification_channel_status=lttng_notification_channel_subscribe(notification_channel,lttng_trigger_get_const_condition(trigger));assert(notification_channel_status==LTTNG_NOTIFICATION_CHANNEL_STATUS_OK);ret=true;break;}}lttng_triggers_destroy(triggers);returnret;}/* * Handles the evaluation `evaluation` of a single notification. */staticvoidhandle_evaluation(conststructlttng_evaluation*evaluation){enumlttng_evaluation_statusevaluation_status;conststructlttng_event_field_value*array_field_value;conststructlttng_event_field_value*string_field_value;enumlttng_event_field_value_statusevent_field_value_status;constchar*string_field_string_value;/* Get the value of the first captured (string) field */evaluation_status=lttng_evaluation_event_rule_matches_get_captured_values(evaluation,&array_field_value);assert(evaluation_status==LTTNG_EVALUATION_STATUS_OK);event_field_value_status=lttng_event_field_value_array_get_element_at_index(array_field_value,0,&string_field_value);assert(event_field_value_status==LTTNG_EVENT_FIELD_VALUE_STATUS_OK);assert(lttng_event_field_value_get_type(string_field_value)==LTTNG_EVENT_FIELD_VALUE_TYPE_STRING);event_field_value_status=lttng_event_field_value_string_get_value(string_field_value,&string_field_string_value);assert(event_field_value_status==LTTNG_EVENT_FIELD_VALUE_STATUS_OK);/* Print the string value of the field */puts(string_field_string_value);}intmain(intargc,char*argv[]){intexit_status=EXIT_SUCCESS;structlttng_notification_channel*notification_channel;enumlttng_notification_channel_statusnotification_channel_status;conststructlttng_condition*condition;constchar*trigger_name;boolsubscribe_res;assert(argc>=2);trigger_name=argv[1];/* * Create a notification channel. * * A notification channel connects the user application to the LTTng * session daemon. * * You can use this notification channel to listen to various types * of notifications. */notification_channel=lttng_notification_channel_create(lttng_session_daemon_notification_endpoint);assert(notification_channel);/* * Subscribe to notifications which match the condition of the * trigger named `trigger_name`. */if(!subscribe(notification_channel,trigger_name)){fprintf(stderr,"Error: Failed to subscribe to notifications (trigger `%s`).\n",trigger_name);exit_status=EXIT_FAILURE;gotoend;}/* * Notification loop. * * Put this in a dedicated thread to avoid blocking the main thread. */while(true){structlttng_notification*notification;enumlttng_notification_channel_statusstatus;conststructlttng_evaluation*notification_evaluation;/* Receive the next notification */status=lttng_notification_channel_get_next_notification(notification_channel,¬ification);switch(status){caseLTTNG_NOTIFICATION_CHANNEL_STATUS_OK:break;caseLTTNG_NOTIFICATION_CHANNEL_STATUS_NOTIFICATIONS_DROPPED:/* * The session daemon can drop notifications if a receiving * application doesn't consume the notifications fast * enough. */continue;caseLTTNG_NOTIFICATION_CHANNEL_STATUS_CLOSED:/* * The session daemon closed the notification channel. * * This is typically caused by a session daemon shutting * down. */gotoend;default:/* Unhandled conditions or errors */exit_status=EXIT_FAILURE;gotoend;}/* * Handle the condition evaluation. * * A notification provides, amongst other things: * * * The condition that caused LTTng to send this notification. * * * The condition evaluation, which provides more specific * information on the evaluation of the condition. */handle_evaluation(lttng_notification_get_evaluation(notification));/* Destroy the notification object */lttng_notification_destroy(notification);}end:lttng_notification_channel_destroy(notification_channel);returnexit_status;}
This application prints the first captured string field value of the
condition evaluation of each LTTng notification it receives.
Build the notif-app application,
using pkg-config
to provide the right compiler and linker flags:
With any command of the lttng(1) command-line tool, set the
--mi option to xml (before the command name) to get an
XML machine interface output, for example:
$
lttng --mi=xml list my-session
A schema definition (XSD) is
available
to ease the integration with external tools as much as possible.
An LTTng trace, which is a CTF trace, has both
data stream files and a metadata stream file. This metadata file
contains, amongst other things, information about the offset of the
clock sources which LTTng uses to assign timestamps to event records when recording.
If, once a recording session is
started, a major
NTP correction
happens, the clock offset of the trace also needs to be updated. Use
the metadata item of the lttng-regenerate(1) command to do so.
The main use case of this command is to allow a system to boot with
an incorrect wall time and have LTTng trace it before its wall time
is corrected. Once the system is known to be in a state where its
wall time is correct, you can run lttng regenerate metadata.
An analysis can use the state dump event records to set an initial state
before it builds the rest of the state from the subsequent event
records. Trace Compass is a notable
example of an application which uses the state dump of an LTTng trace.
When you take a snapshot, it’s possible that the
state dump event records aren’t included in the snapshot trace files
because they were recorded to a sub-buffer that has been
consumed or overwritten already.
Use the statedump item of the lttng-regenerate(1) command to emit
and record the state dump events again.
Non-volatile
random-access memory (NVRAM) is random-access memory that retains its
information when power is turned off (non-volatile). Systems with such
memory can store data structures in RAM and retrieve them after a
reboot, without flushing to typical storage.
Linux supports NVRAM file systems thanks to either
DAX + pmem
(requires Linux 4.1+) or PRAMFS (requires Linux < 4).
This section doesn’t describe how to operate such file systems; we
assume that you have a working persistent memory file system.
When you create a recording session, you can specify the path of the shared memory holding the
sub-buffers. If you specify a location on an NVRAM file system, then you
can retrieve the latest recorded trace data when the system reboots
after a crash.
To record trace data on a persistent memory file system and retrieve the
trace data after a system crash:
Create a recording session with a sub-buffer shared memory
path located on an NVRAM file system:
Configure the recording session as usual with the lttng(1)
command-line tool, and start recording.
After a system crash, use the lttng-crash(1) command-line tool to
read the trace data recorded on the NVRAM file system:
$
lttng-crash /path/to/shm/on/nvram
The binary layout of the ring buffer files isn’t exactly the same as the
trace files layout. This is why you need to use lttng-crash(1)
instead of some standard LTTng trace reader.
To convert the ring buffer files to LTTng trace files:
With the notification and trigger C API of
liblttng-ctl, LTTng can notify your user
application when the buffer usage of one or more channels
becomes too low or too high.
Example:Send a notification to a user application when the buffer usage of an LTTng channel is too high.
In this example, we create and build an application which gets notified
when the buffer usage of a specific LTTng channel is higher than
75 %.
We only print that it’s the case in this example, but we could as well
use the liblttng-ctl C API to disable recording event rules when this happens, for example.
Create the C source file of the application:
notif-app.c
#include<stdlib.h>#include<stdio.h>#include<assert.h>#include<lttng/lttng.h>intmain(intargc,char*argv[]){intexit_status=EXIT_SUCCESS;structlttng_notification_channel*notification_channel;structlttng_condition*condition;structlttng_action*action;structlttng_trigger*trigger;constchar*recording_session_name;constchar*channel_name;assert(argc>=3);recording_session_name=argv[1];channel_name=argv[2];/* * Create a notification channel. * * A notification channel connects the user application to the LTTng * session daemon. * * You can use this notification channel to listen to various types * of notifications. */notification_channel=lttng_notification_channel_create(lttng_session_daemon_notification_endpoint);/* * Create a "buffer usage becomes greater than" condition. * * In this case, the condition is satisfied when the buffer usage * becomes greater than or equal to 75 %. * * We create the condition for a specific recording session name, * channel name, and for the user space tracing domain. * * The following condition types also exist: * * * The buffer usage of a channel becomes less than a given value. * * * The consumed data size of a recording session becomes greater * than a given value. * * * A recording session rotation becomes ongoing. * * * A recording session rotation becomes completed. * * * A given event rule matches an event. */condition=lttng_condition_buffer_usage_high_create();lttng_condition_buffer_usage_set_threshold_ratio(condition,.75);lttng_condition_buffer_usage_set_session_name(condition,recording_session_name);lttng_condition_buffer_usage_set_channel_name(condition,channel_name);lttng_condition_buffer_usage_set_domain_type(condition,LTTNG_DOMAIN_UST);/* * Create an action (receive a notification) to execute when the * condition created above is satisfied. */action=lttng_action_notify_create();/* * Create a trigger. * * A trigger associates a condition to an action: LTTng executes * the action when the condition is satisfied. */trigger=lttng_trigger_create(condition,action);/* Register the trigger to the LTTng session daemon. */lttng_register_trigger(trigger);/* * Now that we have registered a trigger, LTTng will send a * notification every time its condition is met through a * notification channel. * * To receive this notification, we must subscribe to notifications * which match the same condition. */lttng_notification_channel_subscribe(notification_channel,condition);/* * Notification loop. * * Put this in a dedicated thread to avoid blocking the main thread. */for(;;){structlttng_notification*notification;enumlttng_notification_channel_statusstatus;conststructlttng_evaluation*notification_evaluation;conststructlttng_condition*notification_condition;doublebuffer_usage;/* Receive the next notification. */status=lttng_notification_channel_get_next_notification(notification_channel,¬ification);switch(status){caseLTTNG_NOTIFICATION_CHANNEL_STATUS_OK:break;caseLTTNG_NOTIFICATION_CHANNEL_STATUS_NOTIFICATIONS_DROPPED:/* * The session daemon can drop notifications if a monitoring * application isn't consuming the notifications fast * enough. */continue;caseLTTNG_NOTIFICATION_CHANNEL_STATUS_CLOSED:/* * The session daemon closed the notification channel. * * This is typically caused by a session daemon shutting * down. */gotoend;default:/* Unhandled conditions or errors. */exit_status=EXIT_FAILURE;gotoend;}/* * A notification provides, amongst other things: * * * The condition that caused LTTng to send this notification. * * * The condition evaluation, which provides more specific * information on the evaluation of the condition. * * The condition evaluation provides the buffer usage * value at the moment the condition was satisfied. */notification_condition=lttng_notification_get_condition(notification);notification_evaluation=lttng_notification_get_evaluation(notification);/* We're subscribed to only one condition. */assert(lttng_condition_get_type(notification_condition)==LTTNG_CONDITION_TYPE_BUFFER_USAGE_HIGH);/* * Get the exact sampled buffer usage from the condition * evaluation. */lttng_evaluation_buffer_usage_get_usage_ratio(notification_evaluation,&buffer_usage);/* * At this point, instead of printing a message, we could do * something to reduce the buffer usage of the channel, like * disable specific events, for example. */printf("Buffer usage is %f %% in recording session \"%s\", ""user space channel \"%s\".\n",buffer_usage*100,recording_session_name,channel_name);/* Destroy the notification object. */lttng_notification_destroy(notification);}end:lttng_action_destroy(action);lttng_condition_destroy(condition);lttng_trigger_destroy(trigger);lttng_notification_channel_destroy(notification_channel);returnexit_status;}
Build the notif-app application, linking it with liblttng-ctl:
If you create the channel manually with the lttng-enable-channel(1)
command, you can set its monitor timer to
control how frequently LTTng samples the current values of the channel
properties to evaluate user conditions.
Run the notif-app application.
This program accepts the recording session and
user space channel names as its two first arguments. The channel
which LTTng automatically creates with the lttng-enable-event(1)
command above is named channel0:
$
./notif-app my-session channel0
In another terminal, run an application with a very high event
throughput so that the 75 % buffer usage condition is reached.
In the first terminal, the application should print lines like this:
Buffer usage is 81.45197 % in recording session "my-session", user space
channel "channel0".
If you don’t see anything, try to make the threshold of the condition in
notif-app.c lower (0.1 %, for example), and then rebuild the
notif-app application (step 2) and run it again (step 4).
Null-terminated string; undefined behavior if e is NULL.
n
Field name.
e
Argument expression.
ctf_array(t, n, e, s)
ctf_array_nowrite(t, n, e, s)
ctf_user_array(t, n, e, s)
ctf_user_array_nowrite(t, n, e, s)
Statically-sized array of integers.
t
Array element C type.
n
Field name.
e
Argument expression.
s
Number of elements.
ctf_array_bitfield(t, n, e, s)
ctf_array_bitfield_nowrite(t, n, e, s)
ctf_user_array_bitfield(t, n, e, s)
ctf_user_array_bitfield_nowrite(t, n, e, s)
Statically-sized array of bits.
The type of e must be an integer type. s is the number
of elements of such type in e, not the number of bits.
t
Array element C type.
n
Field name.
e
Argument expression.
s
Number of elements.
ctf_array_text(t, n, e, s)
ctf_array_text_nowrite(t, n, e, s)
ctf_user_array_text(t, n, e, s)
ctf_user_array_text_nowrite(t, n, e, s)
Statically-sized array, printed as text.
The string doesn’t need to be null-terminated.
t
Array element C type (always char).
n
Field name.
e
Argument expression.
s
Number of elements.
ctf_sequence(t, n, e, T, E)
ctf_sequence_nowrite(t, n, e, T, E)
ctf_user_sequence(t, n, e, T, E)
ctf_user_sequence_nowrite(t, n, e, T, E)
Dynamically-sized array of integers.
The type of E must be unsigned.
t
Array element C type.
n
Field name.
e
Argument expression.
T
Length expression C type.
E
Length expression.
ctf_sequence_hex(t, n, e, T, E)
ctf_user_sequence_hex(t, n, e, T, E)
Dynamically-sized array of integers, displayed in base 16.
The type of E must be unsigned.
t
Array element C type.
n
Field name.
e
Argument expression.
T
Length expression C type.
E
Length expression.
ctf_sequence_network(t, n, e, T, E)
Dynamically-sized array of integers in network byte order (big-endian),
displayed in base 10.
The type of E must be unsigned.
t
Array element C type.
n
Field name.
e
Argument expression.
T
Length expression C type.
E
Length expression.
ctf_sequence_bitfield(t, n, e, T, E)
ctf_sequence_bitfield_nowrite(t, n, e, T, E)
ctf_user_sequence_bitfield(t, n, e, T, E)
ctf_user_sequence_bitfield_nowrite(t, n, e, T, E)
Dynamically-sized array of bits.
The type of e must be an integer type. s is the number
of elements of such type in e, not the number of bits.
The type of E must be unsigned.
t
Array element C type.
n
Field name.
e
Argument expression.
T
Length expression C type.
E
Length expression.
ctf_sequence_text(t, n, e, T, E)
ctf_sequence_text_nowrite(t, n, e, T, E)
ctf_user_sequence_text(t, n, e, T, E)
ctf_user_sequence_text_nowrite(t, n, e, T, E)
Dynamically-sized array, displayed as text.
The string doesn’t need to be null-terminated.
The type of E must be unsigned.
The behaviour is undefined if e is NULL.
t
Sequence element C type (always char).
n
Field name.
e
Argument expression.
T
Length expression C type.
E
Length expression.
Use the _user versions when the argument expression, e, is
a user space address. In the cases of ctf_user_integer*() and
ctf_user_float*(), &e must be a user space address, thus e must
be addressable.
The _nowrite versions omit themselves from the trace data, but are
otherwise identical. This means LTTng won’t write the _nowrite fields
to the recorded trace. Their primary purpose is to make some of the
event context available to the recording event rule filters without having to commit the data to
sub-buffers.
A program which is responsible for consuming the full
sub-buffers and write them to a file system or
send them over the network.
current trace chunk
A trace chunk which includes the current content
of all the sub-buffers of the
recording session and the stream files
produced since the latest event amongst:
A communication protocol between the relay daemon and
live readers which makes it possible to show or analyze
event records “live”, as they’re received by
the relay daemon.
LTTng doesn’t manage any trace chunk archive, even if its
containing recording session is still active: you
are free to read it, modify it, move it, or remove it.