The LTTng Documentation
Copyright © 2014-2021 The LTTng Project
This work is licensed under a Creative Commons Attribution 4.0 International License.
Warning:This version of the LTTng Documentation is not maintained anymore, since the corresponding version of LTTng is not the current release, nor the previous release.
Visit the latest LTTng Documentation version.
Welcome!
Welcome to the LTTng Documentation!
The Linux Trace Toolkit: next generation is an open source software toolkit which you can use to simultaneously trace the Linux kernel, user applications, and user libraries.
LTTng consists of:
-
Kernel modules to trace the Linux kernel.
-
Shared libraries to trace user applications written in C or C++.
-
Java packages to trace Java applications which use
java.util.loggingor Apache log4j 1.2. -
A kernel module to trace shell scripts and other user applications without a dedicated instrumentation mechanism.
-
Daemons and a command-line tool,
lttng, to control the LTTng tracers.
Open source documentation
Note:This is an open documentation: its source is available in a public Git repository.
Should you find any error in the content of this text, any grammatical mistake, or any dead link, we would be very grateful if you would file a GitHub issue for it or, even better, contribute a patch to this documentation by creating a pull request.
Target audience
The material of this documentation is appropriate for intermediate to advanced software developers working in a Linux environment and interested in efficient software tracing. LTTng is also worth a try for students interested in the inner mechanics of their systems.
If you do not have a programming background, you may wish to skip everything related to instrumentation, which often requires at least some programming language skills.
Chapter descriptions
What follows is a list of brief descriptions of this documentation’s chapters. The latter are ordered in such a way as to make the reading as linear as possible.
-
Nuts and bolts explains the rudiments of software tracing and the rationale behind the LTTng project.
-
Installing LTTng is divided into sections describing the steps needed to get a working installation of LTTng packages for common Linux distributions and from its source.
-
Getting started is a very concise guide to get started quickly with LTTng kernel and user space tracing. This chapter is recommended if you’re new to LTTng or software tracing in general.
-
Understanding LTTng deals with some core concepts and components of the LTTng suite. Understanding those is important since the next chapter assumes you’re familiar with them.
-
Using LTTng is a complete user guide of the LTTng project. It shows in great details how to instrument user applications and the Linux kernel, how to control tracing sessions using the
lttngcommand line tool and miscellaneous practical use cases. -
Reference contains references of LTTng components, like links to online manpages and various APIs.
We recommend that you read the above chapters in this order, although some of them may be skipped depending on your situation. You may skip Nuts and bolts if you’re familiar with tracing and LTTng. Also, you may jump over Installing LTTng if LTTng is already properly installed on your target system.
Convention
Function names, parameter names, variable names, command names, argument
names, file system paths, file names, and other literal strings are
written using a monospace typeface in this document. An italic
word within such a block is a placeholder, usually described in the
following sentence.
Practical tips and notes are given throughout the document using the following style:
Tip:Read the tips.
Terminal boxes are used to show command lines:
$
#
echo Command line as a regular user
echo Command line as a the `root` user
Command lines which you need to execute as a priviledged user start with
the # prompt or with sudo. Other command lines start with the $
prompt.
Acknowledgements
A few people made the online LTTng Documentation possible.
Philippe Proulx wrote most of the content, created the diagrams, and formatted the document. He’s the current maintainer of the LTTng Documentation.
Daniel U. Thibault, from the DRDC, wrote “LTTng: The Linux Trace Toolkit Next Generation — A Comprehensive User’s Guide (version 2.3 edition)” which was used to complete parts of the “Core concepts” and “Components of LTTng” sections and for a few passages here and there.
The entire EfficiOS team made essential reviews of the whole document.
We sincerely thank everyone who helped enhance the quality of this documentation.
What’s new in LTTng 2.6?
Most of the changes of LTTng 2.6 are bug fixes, making the toolchain more stable than ever before. Still, LTTng 2.6 adds some interesting features to the project.
LTTng 2.5 already supported the instrumentation and tracing of
Java applications through java.util.logging
(JUL). LTTng 2.6 goes one step further by supporting
Apache log4j 1.2.
The new log4j domain is selected using the --log4j option in various
commands of the lttng tool.
LTTng-modules has supported system call tracing for a long time, but until now, it was only possible to record either all of them, or none of them. LTTng 2.6 allows the user to record specific system call events, for example:
lttng enable-event --kernel --syscall open,fork,chdir,pipe
Finally, the lttng command line tool is not only able to communicate
with humans as it used to do, but also with machines thanks to its new
machine interface feature.
To learn more about the new features of LTTng 2.6, see the release announcement.
Nuts and bolts
What is LTTng? As its name suggests, the Linux Trace Toolkit: next generation is a modern toolkit for tracing Linux systems and applications. So your first question might rather be: what is tracing?
What is tracing?
As the history of software engineering progressed and led to what we now take for granted—complex, numerous and interdependent software applications running in parallel on sophisticated operating systems like Linux—the authors of such components, or software developers, began feeling a natural urge of having tools to ensure the robustness and good performance of their masterpieces.
One major achievement in this field is, inarguably, the GNU debugger (GDB), which is an essential tool for developers to find and fix bugs. But even the best debugger won’t help make your software run faster, and nowadays, faster software means either more work done by the same hardware, or cheaper hardware for the same work.
A profiler is often the tool of choice to identify performance bottlenecks. Profiling is suitable to identify where performance is lost in a given software; the profiler outputs a profile, a statistical summary of observed events, which you may use to discover which functions took the most time to execute. However, a profiler won’t report why some identified functions are the bottleneck. Bottlenecks might only occur when specific conditions are met, sometimes almost impossible to capture by a statistical profiler, or impossible to reproduce with an application altered by the overhead of an event-based profiler. For a thorough investigation of software performance issues, a history of execution, with the recorded values of chosen variables and context, is essential. This is where tracing comes in handy.
Tracing is a technique used to understand what goes on in a running software system. The software used for tracing is called a tracer, which is conceptually similar to a tape recorder. When recording, specific probes placed in the software source code generate events that are saved on a giant tape: a trace file. Both user applications and the operating system may be traced at the same time, opening the possibility of resolving a wide range of problems that are otherwise extremely challenging.
Tracing is often compared to logging. However, tracers and loggers are two different tools, serving two different purposes. Tracers are designed to record much lower-level events that occur much more frequently than log messages, often in the thousands per second range, with very little execution overhead. Logging is more appropriate for very high-level analysis of less frequent events: user accesses, exceptional conditions (errors and warnings, for example), database transactions, instant messaging communications, and such. More formally, logging is one of several use cases that can be accomplished with tracing.
The list of recorded events inside a trace file may be read manually like a log file for the maximum level of detail, but it is generally much more interesting to perform application-specific analyses to produce reduced statistics and graphs that are useful to resolve a given problem. Trace viewers and analysers are specialized tools designed to do this.
So, in the end, this is what LTTng is: a powerful, open source set of tools to trace the Linux kernel and user applications at the same time. LTTng is composed of several components actively maintained and developed by its community.
Alternatives to LTTng
Excluding proprietary solutions, a few competing software tracers exist for Linux:
-
ftrace is the de facto function tracer of the Linux kernel. Its user interface is a set of special files in sysfs.
-
perf is a performance analyzing tool for Linux which supports hardware performance counters, tracepoints, as well as other counters and types of probes. perf’s controlling utility is the
perfcommand line/curses tool. -
strace is a command line utility which records system calls made by a user process, as well as signal deliveries and changes of process state. strace makes use of ptrace to fulfill its function.
-
SystemTap is a Linux kernel and user space tracer which uses custom user scripts to produce plain text traces. Scripts are converted to the C language, then compiled as Linux kernel modules which are loaded to produce trace data. SystemTap’s primary user interface is the
stapcommand line tool. -
sysdig, like SystemTap, uses scripts to analyze Linux kernel events. Scripts, or chisels in sysdig’s jargon, are written in Lua and executed while the system is being traced, or afterwards. sysdig’s interface is the
sysdigcommand line tool as well as the curses-basedcsysdigtool.
The main distinctive features of LTTng is that it produces correlated kernel and user space traces, as well as doing so with the lowest overhead amongst other solutions. It produces trace files in the CTF format, an optimized file format for production and analyses of multi-gigabyte data. LTTng is the result of close to 10 years of active development by a community of passionate developers. LTTng 2.6 is currently available on some major desktop, server, and embedded Linux distributions.
The main interface for tracing control is a single command line tool
named lttng. The latter can create several tracing sessions,
enable/disable events on the fly, filter them efficiently with custom
user expressions, start/stop tracing, and do much more. Traces can be
recorded on disk or sent over the network, kept totally or partially,
and viewed once tracing becomes inactive or in real-time.
Install LTTng now and start tracing!
Installing LTTng
Not available
Warning:The installation documentation for distributions is not available because this version of the LTTng Documentation is not maintained anymore.
Visit the latest LTTng Documentation version.
LTTng is a set of software components which interact to allow instrumenting the Linux kernel and user applications as well as controlling tracing sessions (starting/stopping tracing, enabling/disabling events, and more). Those components are bundled into the following packages:
- LTTng-tools
-
Libraries and command line interface to control tracing sessions.
- LTTng-modules
-
Linux kernel modules for tracing the kernel.
- LTTng-UST
-
User space tracing library.
Most distributions mark the LTTng-modules and LTTng-UST packages as optional. Note that LTTng-modules is only required if you intend to trace the Linux kernel and LTTng-UST is only required if you intend to trace user space applications.
Getting started with LTTng
This is a small guide to get started quickly with LTTng kernel and user space tracing. For a more thorough understanding of LTTng and intermediate to advanced use cases and, see Understanding LTTng and Using LTTng.
Before reading this guide, make sure LTTng is installed. LTTng-tools is required. Also install LTTng-modules for tracing the Linux kernel and LTTng-UST for tracing your own user space applications. When the traces are finally written and complete, the Viewing and analyzing your traces section of this chapter will help you analyze your tracepoint events to investigate.
Tracing the Linux kernel
Make sure LTTng-tools and LTTng-modules packages are installed.
Since you’re about to trace the Linux kernel itself, let’s look at the
available kernel events using the lttng tool, which has a
Git-like command line structure:
lttng list --kernel
Before tracing, you need to create a session:
sudo lttng create
Tip:You can avoid using sudo in the previous and following commands
if your user is a member of the tracing group.
Let’s now enable some events for this session:
sudo lttng enable-event --kernel sched_switch,sched_process_fork
Or you might want to simply enable all available kernel events (beware that trace files grow rapidly when doing this):
sudo lttng enable-event --kernel --all
Start tracing:
sudo lttng start
By default, traces are saved in
\~/lttng-traces/name-date-time,
where name is the session name.
When you’re done tracing:
sudo lttng stop
sudo lttng destroy
Although destroy looks scary here, it doesn’t actually destroy the
written trace files: it only destroys the tracing session.
What’s next? Have a look at Viewing and analyzing your traces to view and analyze the trace you just recorded.
Tracing your own user application
The previous section helped you create a trace out of Linux kernel events. This section steps you through a simple example showing you how to trace a Hello world program written in C.
Make sure the LTTng-tools and LTTng-UST packages are installed.
Tracing is just like having printf() calls at specific locations of
your source code, albeit LTTng is much faster and more flexible than
printf(). In the LTTng realm, tracepoint() is analogous to
printf().
Unlike printf(), though, tracepoint() does not use a format string to
know the types of its arguments: the formats of all tracepoints must be
defined before using them. So before even writing our Hello world program,
we need to define the format of our tracepoint. This is done by creating a
tracepoint provider, which consists of a tracepoint provider header
(.h file) and a tracepoint provider definition (.c file).
The tracepoint provider header contains some boilerplate as well as a
list of tracepoint definitions and other optional definition entries
which we skip for this quickstart. Each tracepoint is defined using the
TRACEPOINT_EVENT() macro. For each tracepoint, you must provide:
-
a provider name, which is the "scope" or namespace of this tracepoint (this usually includes the company and project names)
-
a tracepoint name
-
a list of arguments for the eventual
tracepoint()call, each item being:-
the argument C type
-
the argument name
-
-
a list of fields, which correspond to the actual fields of the recorded events for this tracepoint
Here’s an example of a simple tracepoint provider header with two arguments: an integer and a string:
#undef TRACEPOINT_PROVIDER
#define TRACEPOINT_PROVIDER hello_world

#undef TRACEPOINT_INCLUDE
#define TRACEPOINT_INCLUDE "./hello-tp.h"

#if !defined(_HELLO_TP_H) || defined(TRACEPOINT_HEADER_MULTI_READ)
#define _HELLO_TP_H

#include <lttng/tracepoint.h>

TRACEPOINT_EVENT(
    hello_world,
    my_first_tracepoint,
    TP_ARGS(
        int, my_integer_arg,
        char*, my_string_arg
    ),
    TP_FIELDS(
        ctf_string(my_string_field, my_string_arg)
        ctf_integer(int, my_integer_field, my_integer_arg)
    )
)

#endif /* _HELLO_TP_H */

#include <lttng/tracepoint-event.h>
The exact syntax is well explained in the C application instrumentation guide of the Using LTTng chapter, as well as in lttng-ust(3).
Save the above snippet as hello-tp.h.
Write the tracepoint provider definition as hello-tp.c:
#define TRACEPOINT_CREATE_PROBES
#define TRACEPOINT_DEFINE

#include "hello-tp.h"
Create the tracepoint provider:
gcc -c -I. hello-tp.c
Now, by including hello-tp.h in your own application, you may use the
tracepoint defined above by properly refering to it when calling
tracepoint():
#include <stdio.h>
#include "hello-tp.h"

int main(int argc, char *argv[])
{
    int x;

    puts("Hello, World!\nPress Enter to continue...");

    /*
     * The following getchar() call is only placed here for the purpose
     * of this demonstration, for pausing the application in order for
     * you to have time to list its events. It's not needed otherwise.
     */
    getchar();

    /*
     * A tracepoint() call. Arguments, as defined in hello-tp.h:
     *
     *     1st: provider name (always)
     *     2nd: tracepoint name (always)
     *     3rd: my_integer_arg (first user-defined argument)
     *     4th: my_string_arg (second user-defined argument)
     *
     * Notice the provider and tracepoint names are NOT strings;
     * they are in fact parts of variables created by macros in
     * hello-tp.h.
     */
    tracepoint(hello_world, my_first_tracepoint, 23, "hi there!");

    for (x = 0; x < argc; ++x) {
        tracepoint(hello_world, my_first_tracepoint, x, argv[x]);
    }

    puts("Quitting now!");

    tracepoint(hello_world, my_first_tracepoint, x * x, "x^2");

    return 0;
}
Save this as hello.c, next to hello-tp.c.
Notice hello-tp.h, the tracepoint provider header, is included
by hello.c.
You are now ready to compile the application with LTTng-UST support:
gcc -c hello.c
gcc -o hello hello.o hello-tp.o -llttng-ust -ldl
Here’s the whole build process:
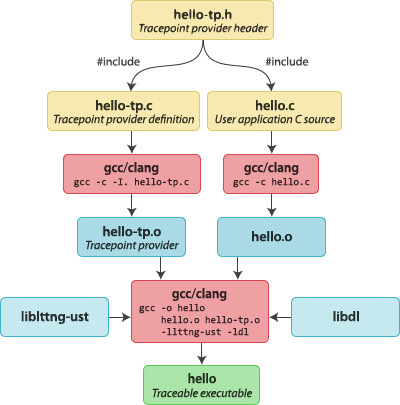
If you followed the Tracing the Linux kernel tutorial, the following steps should look familiar.
First, run the application with a few arguments:
./hello world and beyond
You should see
Hello, World!
Press Enter to continue...
Use the lttng tool to list all available user space events:
lttng list --userspace
You should see the hello_world:my_first_tracepoint tracepoint listed
under the ./hello process.
Create a tracing session:
lttng create
Enable the hello_world:my_first_tracepoint tracepoint:
lttng enable-event --userspace hello_world:my_first_tracepoint
Start tracing:
lttng start
Go back to the running hello application and press Enter. All tracepoint()
calls are executed and the program finally exits.
Stop tracing:
lttng stop
Done! You may use lttng view to list the recorded events. This command
starts babeltrace
in the background, if it’s installed:
lttng view
should output something like:
[18:10:27.684304496] (+?.?????????) hostname hello_world:my_first_tracepoint: { cpu_id = 0 }, { my_string_field = "hi there!", my_integer_field = 23 }
[18:10:27.684338440] (+0.000033944) hostname hello_world:my_first_tracepoint: { cpu_id = 0 }, { my_string_field = "./hello", my_integer_field = 0 }
[18:10:27.684340692] (+0.000002252) hostname hello_world:my_first_tracepoint: { cpu_id = 0 }, { my_string_field = "world", my_integer_field = 1 }
[18:10:27.684342616] (+0.000001924) hostname hello_world:my_first_tracepoint: { cpu_id = 0 }, { my_string_field = "and", my_integer_field = 2 }
[18:10:27.684343518] (+0.000000902) hostname hello_world:my_first_tracepoint: { cpu_id = 0 }, { my_string_field = "beyond", my_integer_field = 3 }
[18:10:27.684357978] (+0.000014460) hostname hello_world:my_first_tracepoint: { cpu_id = 0 }, { my_string_field = "x^2", my_integer_field = 16 }
When you’re done, you may destroy the tracing session, which does not destroy the generated trace files, leaving them available for further analysis:
lttng destroy
The next section presents other alternatives to view and analyze your LTTng traces.
Viewing and analyzing your traces
This section describes how to visualize the data gathered after tracing the Linux kernel or a user space application.
Many ways exist to read LTTng traces:
-
babeltraceis a command line utility which converts trace formats; it supports the format used by LTTng, CTF, as well as a basic text output which may begreped. Thebabeltracecommand is part of the Babeltrace project. -
Babeltrace also includes Python bindings so that you may easily open and read an LTTng trace with your own script, benefiting from the power of Python.
-
Trace Compass is an Eclipse plugin used to visualize and analyze various types of traces, including LTTng’s. It also comes as a standalone application.
LTTng trace files are usually recorded in the ~/lttng-traces directory.
Let’s now view the trace and perform a basic analysis using
babeltrace.
The simplest way to list all the recorded events of a trace is to pass its
path to babeltrace with no options:
babeltrace ~/lttng-traces/my-session
babeltrace finds all traces recursively within the given path and
prints all their events, merging them in order of time.
Listing all the system calls of a Linux kernel trace with their arguments is
easy with babeltrace and grep:
babeltrace ~/lttng-traces/my-kernel-session | grep sys_
Counting events is also straightforward:
babeltrace ~/lttng-traces/my-kernel-session | grep sys_read | wc --lines
The text output of babeltrace is useful for isolating events by simple
matching using grep and similar utilities. However, more elaborate filters
such as keeping only events with a field value falling within a specific range
are not trivial to write using a shell. Moreover, reductions and even the
most basic computations involving multiple events are virtually impossible
to implement.
Fortunately, Babeltrace ships with Python 3 bindings which makes it really easy to read the events of an LTTng trace sequentially and compute the desired information.
Here’s a simple example using the Babeltrace Python bindings. The following script accepts an LTTng Linux kernel trace path as its first argument and prints the short names of the top 5 running processes on CPU 0 during the whole trace:
import sys
from collections import Counter
import babeltrace


def top5proc():
    if len(sys.argv) != 2:
        msg = 'Usage: python {} TRACEPATH'.format(sys.argv[0])
        raise ValueError(msg)

    # a trace collection holds one to many traces
    col = babeltrace.TraceCollection()

    # add the trace provided by the user
    # (LTTng traces always have the 'ctf' format)
    if col.add_trace(sys.argv[1], 'ctf') is None:
        raise RuntimeError('Cannot add trace')

    # this counter dict will hold execution times:
    #
    #   task command name -> total execution time (ns)
    exec_times = Counter()

    # this holds the last `sched_switch` timestamp
    last_ts = None

    # iterate events
    for event in col.events:
        # keep only `sched_switch` events
        if event.name != 'sched_switch':
            continue

        # keep only events which happened on CPU 0
        if event['cpu_id'] != 0:
            continue

        # event timestamp
        cur_ts = event.timestamp

        if last_ts is None:
            # we start here
            last_ts = cur_ts

        # previous task command (short) name
        prev_comm = event['prev_comm']

        # initialize entry in our dict if not yet done
        if prev_comm not in exec_times:
            exec_times[prev_comm] = 0

        # compute previous command execution time
        diff = cur_ts - last_ts

        # update execution time of this command
        exec_times[prev_comm] += diff

        # update last timestamp
        last_ts = cur_ts

    # display top 10
    for name, ns in exec_times.most_common(5):
        s = ns / 1000000000
        print('{:20}{} s'.format(name, s))


if __name__ == '__main__':
    top5proc()
Save this script as top5proc.py and run it with Python 3, providing the
path to an LTTng Linux kernel trace as the first argument:
python3 top5proc.py ~/lttng-sessions/my-session-.../kernel
Make sure the path you provide is the directory containing actual trace
files (channel0_0, metadata, and the rest): the babeltrace utility
recurses directories, but the Python bindings do not.
Here’s an example of output:
swapper/0           48.607245889 s
chromium            7.192738188 s
pavucontrol         0.709894415 s
Compositor          0.660867933 s
Xorg.bin            0.616753786 s
Note that swapper/0 is the "idle" process of CPU 0 on Linux; since we
weren’t using the CPU that much when tracing, its first position in the list
makes sense.
Understanding LTTng
If you’re going to use LTTng in any serious way, it is fundamental that you become familiar with its core concepts. Technical terms like tracing sessions, domains, channels and events are used over and over in the Using LTTng chapter, and it is assumed that you understand what they mean when reading it.
LTTng, as you already know, is a toolkit. It would be wrong to call it a simple tool since it is composed of multiple interacting components. This chapter also describes the latter, providing details about their respective roles and how they connect together to form the current LTTng ecosystem.
Core concepts
This section explains the various elementary concepts a user has to deal with when using LTTng. They are:
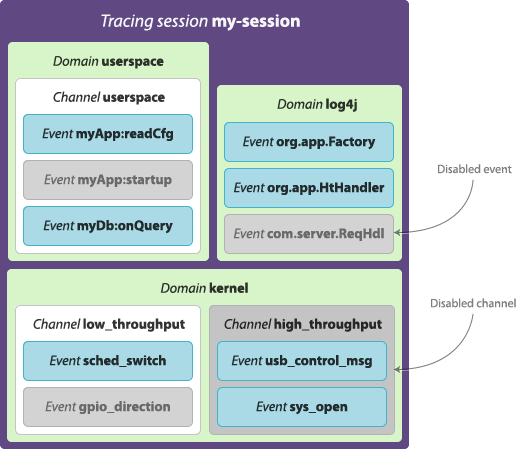
Tracing session
A tracing session is—like any session—a container of state. Anything that is done when tracing using LTTng happens in the scope of a tracing session. In this regard, it is analogous to a bank website’s session: you can’t interact online with your bank account unless you are logged in a session, except for reading a few static webpages (LTTng, too, can report some static information that does not need a created tracing session).
A tracing session holds the following attributes and objects (some of which are described in the following sections):
-
a name
-
the tracing state (tracing started or stopped)
-
the trace data output path/URL (local path or sent over the network)
-
a mode (normal, snapshot or live)
-
the snapshot output paths/URLs (if applicable)
-
for each channel:
-
a name
-
the channel state (enabled or disabled)
-
its parameters (event loss mode, sub-buffers size and count, timer periods, output type, trace files size and count, and the rest)
-
a list of added context information
-
a list of events
-
-
for each event:
-
its state (enabled or disabled)
-
a list of instrumentation points (tracepoints, system calls, dynamic probes, other types of probes)
-
associated log levels
-
a filter expression
-
All this information is completely isolated between tracing sessions. As you can see in the list above, even the tracing state is a per-tracing session attribute, so that you may trace your target system/application in a given tracing session with a specific configuration while another one stays inactive.
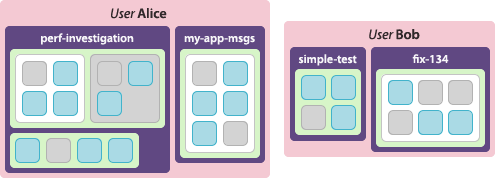
Conceptually, a tracing session is a per-user object; the Plumbing section shows how this is actually implemented. Any user may create as many concurrent tracing sessions as desired.
The trace data generated in a tracing session may be either saved to disk, sent over the network or not saved at all (in which case snapshots may still be saved to disk or sent to a remote machine).
Domain
A tracing domain is the official term the LTTng project uses to designate a tracer category.
There are currently four known domains:
-
Linux kernel
-
user space
-
java.util.logging(JUL) -
log4j
Different tracers expose common features in their own interfaces, but, from a user’s perspective, you still need to target a specific type of tracer to perform some actions. For example, since both kernel and user space tracers support named tracepoints (probes manually inserted in source code), you need to specify which one is concerned when enabling an event because both domains could have existing events with the same name.
Some features are not available in all domains. Filtering enabled events using custom expressions, for example, is currently not supported in the kernel domain, but support could be added in the future.
Channel
A channel is a set of events with specific parameters and potential added context information. Channels have unique names per domain within a tracing session. A given event is always registered to at least one channel; having the same enabled event in two channels makes this event being recorded twice everytime it occurs.
Channels may be individually enabled or disabled. Occurring events of a disabled channel never make it to recorded events.
The fundamental role of a channel is to keep a shared ring buffer, where events are eventually recorded by the tracer and consumed by a consumer daemon. This internal ring buffer is divided into many sub-buffers of equal size.
Channels, when created, may be fine-tuned thanks to a few parameters, many of them related to sub-buffers. The following subsections explain what those parameters are and in which situations you should manually adjust them.
Overwrite and discard event loss modes
As previously mentioned, a channel’s ring buffer is divided into many equally sized sub-buffers.
As events occur, they are serialized as trace data into a specific sub-buffer (yellow arc in the following animation) until it is full: when this happens, the sub-buffer is marked as consumable (red) and another, empty (white) sub-buffer starts receiving the following events. The marked sub-buffer is eventually consumed by a consumer daemon (returns to white).
In an ideal world, sub-buffers are consumed faster than filled, like it is the case above. In the real world, however, all sub-buffers could be full at some point, leaving no space to record the following events. By design, LTTng is a non-blocking tracer: when no empty sub-buffer exists, losing events is acceptable when the alternative would be to cause substantial delays in the instrumented application’s execution. LTTng privileges performance over integrity, aiming at perturbing the traced system as little as possible in order to make tracing of subtle race conditions and rare interrupt cascades possible.
When it comes to losing events because no empty sub-buffer is available, the channel’s event loss mode determines what to do amongst:
- Discard
-
Drop the newest events until a sub-buffer is released.
- Overwrite
-
Clear the sub-buffer containing the oldest recorded events and start recording the newest events there. This mode is sometimes called flight recorder mode because it behaves like a flight recorder: always keep a fixed amount of the latest data.
Which mechanism you should choose depends on your context: prioritize the newest or the oldest events in the ring buffer?
Beware that, in overwrite mode, a whole sub-buffer is abandoned as soon as a new event doesn’t find an empty sub-buffer, whereas in discard mode, only the event that doesn’t fit is discarded.
Also note that a count of lost events is incremented and saved in the trace itself when an event is lost in discard mode, whereas no information is kept when a sub-buffer gets overwritten before being committed.
There are known ways to decrease your probability of losing events. The next section shows how tuning the sub-buffers count and size can be used to virtually stop losing events.
Sub-buffers count and size
For each channel, an LTTng user may set its number of sub-buffers and their size.
Note that there is a noticeable tracer’s CPU overhead introduced when switching sub-buffers (marking a full one as consumable and switching to an empty one for the following events to be recorded). Knowing this, the following list presents a few practical situations along with how to configure sub-buffers for them:
- High event throughput
-
In general, prefer bigger sub-buffers to lower the risk of losing events. Having bigger sub-buffers also ensures a lower sub-buffer switching frequency. The number of sub-buffers is only meaningful if the channel is enabled in overwrite mode: in this case, if a sub-buffer overwrite happens, the other sub-buffers are left unaltered.
- Low event throughput
-
In general, prefer smaller sub-buffers since the risk of losing events is already low. Since events happen less frequently, the sub-buffer switching frequency should remain low and thus the tracer’s overhead should not be a problem.
- Low memory system
-
If your target system has a low memory limit, prefer fewer first, then smaller sub-buffers. Even if the system is limited in memory, you want to keep the sub-buffers as big as possible to avoid a high sub-buffer switching frequency.
You should know that LTTng uses CTF as its trace format, which means event data is very compact. For example, the average LTTng Linux kernel event weights about 32 bytes. A sub-buffer size of 1 MiB is thus considered big.
The previous situations highlight the major trade-off between a few big sub-buffers and more, smaller sub-buffers: sub-buffer switching frequency vs. how much data is lost in overwrite mode. Assuming a constant event throughput and using the overwrite mode, the two following configurations have the same ring buffer total size:
-
2 sub-buffers of 4 MiB each lead to a very low sub-buffer switching frequency, but if a sub-buffer overwrite happens, half of the recorded events so far (4 MiB) are definitely lost.
-
8 sub-buffers of 1 MiB each lead to 4 times the tracer’s overhead as the previous configuration, but if a sub-buffer overwrite happens, only the eighth of events recorded so far are definitely lost.
In discard mode, the sub-buffers count parameter is pointless: use two sub-buffers and set their size according to the requirements of your situation.
Switch timer
The switch timer period is another important configurable feature of channels to ensure periodic sub-buffer flushing.
When the switch timer fires, a sub-buffer switch happens. This timer may be used to ensure that event data is consumed and committed to trace files periodically in case of a low event throughput:
It’s also convenient when big sub-buffers are used to cope with sporadic high event throughput, even if the throughput is normally lower.
Buffering schemes
In the user space tracing domain, two buffering schemes are available when creating a channel:
- Per-PID buffering
-
Keep one ring buffer per process.
- Per-UID buffering
-
Keep one ring buffer for all processes of a single user.
The per-PID buffering scheme consumes more memory than the per-UID option if more than one process is instrumented for LTTng-UST. However, per-PID buffering ensures that one process having a high event throughput won’t fill all the shared sub-buffers, only its own.
The Linux kernel tracing domain only has one available buffering scheme which is to use a single ring buffer for the whole system.
Event
An event, in LTTng’s realm, is a term often used metonymically, having multiple definitions depending on the context:
-
When tracing, an event is a point in space-time. Space, in a tracing context, is the set of all executable positions of a compiled application by a logical processor. When a program is executed by a processor and some instrumentation point, or probe, is encountered, an event occurs. This event is accompanied by some contextual payload (values of specific variables at this point of execution) which may or may not be recorded.
-
In the context of a recorded trace file, the term event implies a recorded event.
-
When configuring a tracing session, enabled events refer to specific rules which could lead to the transfer of actual occurring events (1) to recorded events (2).
The whole Core concepts section focuses on the third definition. An event is always registered to one or more channels and may be enabled or disabled at will per channel. A disabled event never leads to a recorded event, even if its channel is enabled.
An event (3) is enabled with a few conditions that must all be met when an event (1) happens in order to generate a recorded event (2):
-
A probe or group of probes in the traced application must be executed.
-
Optionally, the probe must have a log level matching a log level range specified when enabling the event.
-
Optionally, the occurring event must satisfy a custom expression, or filter, specified when enabling the event.
Plumbing
The previous section described the concepts at the heart of LTTng. This section summarizes LTTng’s implementation: how those objects are managed by different applications and libraries working together to form the toolkit.
Overview
As mentioned previously, the whole LTTng suite is made of the LTTng-tools, LTTng-UST, and LTTng-modules packages. Together, they provide different daemons, libraries, kernel modules and command line interfaces. The following tree shows which usable component belongs to which package:
-
LTTng-tools:
-
session daemon (
lttng-sessiond) -
consumer daemon (
lttng-consumerd) -
relay daemon (
lttng-relayd) -
tracing control library (
liblttng-ctl) -
tracing control command line tool (
lttng)
-
-
LTTng-UST:
-
user space tracing library (
liblttng-ust) and its headers -
preloadable user space tracing helpers (
liblttng-ust-libc-wrapper,liblttng-ust-pthread-wrapper,liblttng-ust-cyg-profile,liblttng-ust-cyg-profile-fastandliblttng-ust-dl) -
user space tracepoint code generator command line tool (
lttng-gen-tp) -
java.util.logging/log4j tracepoint providers (liblttng-ust-jul-jniandliblttng-ust-log4j-jni) and JAR file (liblttng-ust-agent.jar)
-
-
LTTng-modules:
-
LTTng Linux kernel tracer module
-
tracing ring buffer kernel modules
-
many LTTng probe kernel modules
-
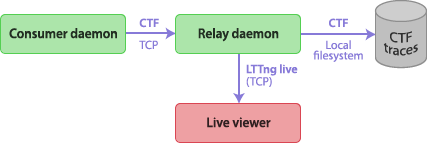
The following diagram shows how the most important LTTng components interact. Plain purple arrows represent trace data paths while dashed red arrows indicate control communications. The LTTng relay daemon is shown running on a remote system, although it could as well run on the target (monitored) system.
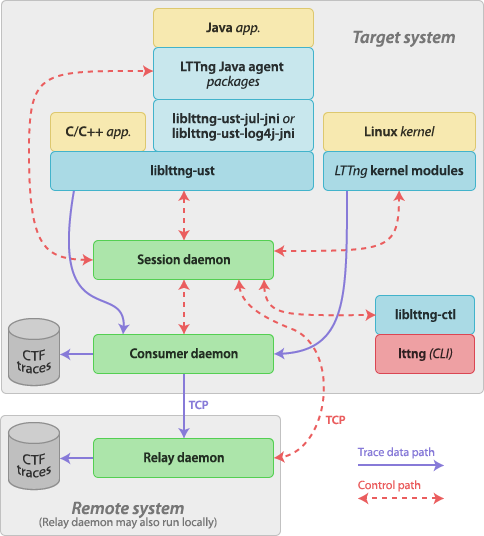
Each component is described in the following subsections.
Session daemon
At the heart of LTTng’s plumbing is the session daemon, often called
by its command name, lttng-sessiond.
The session daemon is responsible for managing tracing sessions and what they logically contain (channel properties, enabled/disabled events, and the rest). By communicating locally with instrumented applications (using LTTng-UST) and with the LTTng Linux kernel modules (LTTng-modules), it oversees all tracing activities.
One of the many things that lttng-sessiond does is to keep
track of the available event types. User space applications and
libraries actively connect and register to the session daemon when they
start. By contrast, lttng-sessiond seeks out and loads the appropriate
LTTng kernel modules as part of its own initialization. Kernel event
types are pulled by lttng-sessiond, whereas user space event types
are pushed to it by the various user space tracepoint providers.
Using a specific inter-process communication protocol with Linux kernel and user space tracers, the session daemon can send channel information so that they are initialized, enable/disable specific probes based on enabled/disabled events by the user, send event filters information to LTTng tracers so that filtering actually happens at the tracer site, start/stop tracing a specific application or the Linux kernel, and more.
The session daemon is not useful without some user controlling it,
because it’s only a sophisticated control interchange and thus
doesn’t make any decision on its own. lttng-sessiond opens a local
socket for controlling it, albeit the preferred way to control it is
using liblttng-ctl, an installed C library hiding the communication
protocol behind an easy-to-use API. The lttng tool makes use of
liblttng-ctl to implement a user-friendly command line interface.
lttng-sessiond does not receive any trace data from instrumented
applications; the consumer daemons are the programs responsible for
collecting trace data using shared ring buffers. However, the session
daemon is the one that must spawn a consumer daemon and establish
a control communication with it.
Session daemons run on a per-user basis. Knowing this, multiple
instances of lttng-sessiond may run simultaneously, each belonging
to a different user and each operating independently of the others.
Only root's session daemon, however, may control LTTng kernel modules
(that is, the kernel tracer). With that in mind, if a user has no root
access on the target system, he cannot trace the system’s kernel, but
should still be able to trace its own instrumented applications.
It has to be noted that, although only root's session daemon may
control the kernel tracer, the lttng-sessiond command has a --group
option which may be used to specify the name of a special user group
allowed to communicate with root's session daemon and thus record
kernel traces. By default, this group is named tracing.
If not done yet, the lttng tool, by default, automatically starts a
session daemon. lttng-sessiond may also be started manually:
lttng-sessiond
This starts the session daemon in foreground. Use
lttng-sessiond --daemonize
to start it as a true daemon.
To kill the current user’s session daemon, pkill may be used:
pkill lttng-sessiond
The default SIGTERM signal terminates it cleanly.
Several other options are available and described in
lttng-sessiond(8) or by running lttng-sessiond --help.
Consumer daemon
The consumer daemon, or lttng-consumerd, is a program sharing some
ring buffers with user applications or the LTTng kernel modules to
collect trace data and output it at some place (on disk or sent over
the network to an LTTng relay daemon).
Consumer daemons are created by a session daemon as soon as events are
enabled within a tracing session, well before tracing is activated
for the latter. Entirely managed by session daemons,
consumer daemons survive session destruction to be reused later,
should a new tracing session be created. Consumer daemons are always
owned by the same user as their session daemon. When its owner session
daemon is killed, the consumer daemon also exits. This is because
the consumer daemon is always the child process of a session daemon.
Consumer daemons should never be started manually. For this reason,
they are not installed in one of the usual locations listed in the
PATH environment variable. lttng-sessiond has, however, a
bunch of options (see lttng-sessiond(8)) to
specify custom consumer daemon paths if, for some reason, a consumer
daemon other than the default installed one is needed.
There are up to two running consumer daemons per user, whereas only one
session daemon may run per user. This is because each process has
independent bitness: if the target system runs a mixture of 32-bit and
64-bit processes, it is more efficient to have separate corresponding
32-bit and 64-bit consumer daemons. The root user is an exception: it
may have up to three running consumer daemons: 32-bit and 64-bit
instances for its user space applications and one more reserved for
collecting kernel trace data.
As new tracing domains are added to LTTng, the development community’s
intent is to minimize the need for additionnal consumer daemon instances
dedicated to them. For instance, the java.util.logging (JUL) domain
events are in fact mapped to the user space domain, thus tracing this
particular domain is handled by existing user space domain consumer
daemons.
Relay daemon
When a tracing session is configured to send its trace data over the
network, an LTTng relay daemon must be used at the other end to
receive trace packets and serialize them to trace files. This setup
makes it possible to trace a target system without ever committing trace
data to its local storage, a feature which is useful for embedded
systems, amongst others. The command implementing the relay daemon
is lttng-relayd.
The basic use case of lttng-relayd is to transfer trace data received
over the network to trace files on the local file system. The relay
daemon must listen on two TCP ports to achieve this: one control port,
used by the target session daemon, and one data port, used by the
target consumer daemon. The relay and session daemons agree on common
default ports when custom ones are not specified.
Since the communication transport protocol for both ports is standard TCP, the relay daemon may be started either remotely or locally (on the target system).
While two instances of consumer daemons (32-bit and 64-bit) may run
concurrently for a given user, lttng-relayd needs only be of its
host operating system’s bitness.
The other important feature of LTTng’s relay daemon is the support of LTTng live. LTTng live is an application protocol to view events as they arrive. The relay daemon still records events in trace files, but a tee allows to inspect incoming events.
Using LTTng live locally thus requires to run a local relay daemon.
Control library and command line interface
The LTTng control library, liblttng-ctl, can be used to communicate
with the session daemon using a C API that hides the underlying
protocol’s details. liblttng-ctl is part of LTTng-tools.
liblttng-ctl may be used by including its "master" header:
#include <lttng/lttng.h>
Some objects are referred by name (C string), such as tracing sessions,
but most of them require creating a handle first using
lttng_create_handle(). The best available developer documentation for
liblttng-ctl is, for the moment, its installed header files as such.
Every function/structure is thoroughly documented.
The lttng program is the de facto standard user interface to
control LTTng tracing sessions. lttng uses liblttng-ctl to
communicate with session daemons behind the scenes.
Its man page, lttng(1), is exhaustive, as well as its command
line help (lttng cmd --help, where cmd is the command name).
The Controlling tracing section is a feature
tour of the lttng tool.
User space tracing library
The user space tracing part of LTTng is possible thanks to the user
space tracing library, liblttng-ust, which is part of the LTTng-UST
package.
liblttng-ust provides header files containing macros used to define
tracepoints and create tracepoint providers, as well as a shared object
that must be linked to individual applications to connect to and
communicate with a session daemon and a consumer daemon as soon as the
application starts.
The exact mechanism by which an application is registered to the
session daemon is beyond the scope of this documentation. The only thing
you need to know is that, since the library constructor does this job
automatically, tracepoints may be safely inserted anywhere in the source
code without prior manual initialization of liblttng-ust.
The liblttng-ust-session daemon collaboration also provides an
interesting feature: user space events may be enabled before
applications actually start. By doing this and starting tracing before
launching the instrumented application, you make sure that even the
earliest occurring events can be recorded.
The C application instrumenting guide of the
Using LTTng chapter focuses on using liblttng-ust:
instrumenting, building/linking and running a user application.
LTTng kernel modules
The LTTng Linux kernel modules provide everything needed to trace the Linux kernel: various probes, a ring buffer implementation for a consumer daemon to read trace data and the tracer itself.
Only in exceptional circumstances should you ever need to load the
LTTng kernel modules manually: it is normally the responsability of
root's session daemon to do so. Even if you were to develop your
own LTTng probe module—for tracing a custom kernel or some kernel
module (this topic is covered in the
Linux kernel instrumenting guide of
the Using LTTng chapter)—you
should use the --extra-kmod-probes option of the session daemon to
append your probe to the default list. The session and consumer daemons
of regular users do not interact with the LTTng kernel modules at all.
LTTng kernel modules are installed, by default, in
/usr/lib/modules/release/extra, where release is the
kernel release (see uname --kernel-release).
Using LTTng
Using LTTng involves two main activities: instrumenting and controlling tracing.
Instrumenting is the process of inserting probes into some source code. It can be done manually, by writing tracepoint calls at specific locations in the source code of the program to trace, or more automatically using dynamic probes (address in assembled code, symbol name, function entry/return, and others).
It has to be noted that, as an LTTng user, you may not have to worry about the instrumentation process. Indeed, you may want to trace a program already instrumented. As an example, the Linux kernel is thoroughly instrumented, which is why you can trace it without caring about adding probes.
Controlling tracing is everything
that can be done by the LTTng session daemon, which is controlled using
liblttng-ctl or its command line utility, lttng: creating tracing
sessions, listing tracing sessions and events, enabling/disabling
events, starting/stopping the tracers, taking snapshots, amongst many
other commands.
This chapter is a complete user guide of both activities, with common use cases of LTTng exposed throughout the text. It is assumed that you are familiar with LTTng’s concepts (events, channels, domains, tracing sessions) and that you understand the roles of its components (daemons, libraries, command line tools); if not, we invite you to read the Understanding LTTng chapter before you begin reading this one.
If you’re new to LTTng, we suggest that you rather start with the Getting started small guide first, then come back here to broaden your knowledge.
If you’re only interested in tracing the Linux kernel with its current instrumentation, you may skip the Instrumenting section.
Instrumenting
There are many examples of tracing and monitoring in our everyday life. You have access to real-time and historical weather reports and forecasts thanks to weather stations installed around the country. You know your possibly hospitalized friends' and family’s hearts are safe thanks to electrocardiography. You make sure not to drive your car too fast and have enough fuel to reach your destination thanks to gauges visible on your dashboard.
All the previous examples have something in common: they rely on probes. Without electrodes attached to the surface of a body’s skin, cardiac monitoring would be futile.
LTTng, as a tracer, is no different from the real life examples above. If you’re about to trace a software system or, put in other words, record its history of execution, you better have probes in the subject you’re tracing: the actual software. Various ways were developed to do this. The most straightforward one is to manually place probes, called tracepoints, in the software’s source code. The Linux kernel tracing domain also allows probes added dynamically.
If you’re only interested in tracing the Linux kernel, it may very well be that your tracing needs are already appropriately covered by LTTng’s built-in Linux kernel tracepoints and other probes. Or you may be in possession of a user space application which has already been instrumented. In such cases, the work resides entirely in the design and execution of tracing sessions, allowing you to jump to Controlling tracing right now.
This chapter focuses on the following use cases of instrumentation:
-
Linux kernel module or the kernel itself
Some advanced techniques are also presented at the very end of this chapter.
C application
Instrumenting a C (or C++) application, be it an executable program
or a library, implies using LTTng-UST, the
user space tracing component of LTTng. For C/C++ applications, the
LTTng-UST package includes a dynamically loaded library
(liblttng-ust), C headers and the lttng-gen-tp command line utility.
Since C and C++ are the base languages of virtually all other programming languages (Java virtual machine, Python, Perl, PHP and Node.js interpreters, to name a few), implementing user space tracing for an unsupported language is just a matter of using the LTTng-UST C API at the right places.
The usual work flow to instrument a user space C application with LTTng-UST is:
-
Define tracepoints (actual probes)
-
Write tracepoint providers
-
Insert tracepoints into target source code
-
Package (build) tracepoint providers
-
Build user application and link it with tracepoint providers
The steps above are discussed in greater detail in the following subsections.
Tracepoint provider
Before jumping into defining tracepoints and inserting them into the application source code, you must understand what a tracepoint provider is.
For the sake of this guide, consider the following two files:
tp.h
#undef TRACEPOINT_PROVIDER
#define TRACEPOINT_PROVIDER my_provider

#undef TRACEPOINT_INCLUDE
#define TRACEPOINT_INCLUDE "./tp.h"

#if !defined(_TP_H) || defined(TRACEPOINT_HEADER_MULTI_READ)
#define _TP_H

#include <lttng/tracepoint.h>

TRACEPOINT_EVENT(
    my_provider,
    my_first_tracepoint,
    TP_ARGS(
        int, my_integer_arg,
        char*, my_string_arg
    ),
    TP_FIELDS(
        ctf_string(my_string_field, my_string_arg)
        ctf_integer(int, my_integer_field, my_integer_arg)
    )
)

TRACEPOINT_EVENT(
    my_provider,
    my_other_tracepoint,
    TP_ARGS(
        int, my_int
    ),
    TP_FIELDS(
        ctf_integer(int, some_field, my_int)
    )
)

#endif /* _TP_H */

#include <lttng/tracepoint-event.h>
tp.c
#define TRACEPOINT_CREATE_PROBES

#include "tp.h"
The two files above are defining a tracepoint provider. A tracepoint
provider is some sort of namespace for tracepoint definitions. Tracepoint
definitions are written above with the TRACEPOINT_EVENT() macro, and allow
eventual tracepoint() calls respecting their definitions to be inserted
into the user application’s C source code (we explore this in a
later section).
Many tracepoint definitions may be part of the same tracepoint provider and many tracepoint providers may coexist in a user space application. A tracepoint provider is packaged either:
-
directly into an existing user application’s C source file
-
as an object file
-
as a static library
-
as a shared library
The two files above, tp.h and tp.c, show a typical template for
writing a tracepoint provider. LTTng-UST was designed so that two
tracepoint providers should not be defined in the same header file.
We will now go through the various parts of the above files and give them a meaning. As you may have noticed, the LTTng-UST API for C/C++ applications is some preprocessor sorcery. The LTTng-UST macros used in your application and those in the LTTng-UST headers are combined to produce actual source code needed to make tracing possible using LTTng.
Let’s start with the header file, tp.h. It begins with
#undef TRACEPOINT_PROVIDER
#define TRACEPOINT_PROVIDER my_provider
TRACEPOINT_PROVIDER defines the name of the provider to which the
following tracepoint definitions belong. It is used internally by
LTTng-UST headers and must be defined. Since TRACEPOINT_PROVIDER
could have been defined by another header file also included by the same
C source file, the best practice is to undefine it first.
Note:Names in LTTng-UST follow the C identifier syntax (starting with a letter and containing either letters, numbers or underscores); they are not C strings (not surrounded by double quotes). This is because LTTng-UST macros use those identifier-like strings to create symbols (named types and variables).
The tracepoint provider is a group of tracepoint definitions; its chosen
name should reflect this. A hierarchy like Java packages is recommended,
using underscores instead of dots, for example,
org_company_project_component.
Next is TRACEPOINT_INCLUDE:
#undef TRACEPOINT_INCLUDE
#define TRACEPOINT_INCLUDE "./tp.h"
This little bit of instrospection is needed by LTTng-UST to include your header at various predefined places.
Include guard follows:
#if !defined(_TP_H) || defined(TRACEPOINT_HEADER_MULTI_READ)
#define _TP_H
Add these precompiler conditionals to ensure the tracepoint event generation can include this file more than once.
The TRACEPOINT_EVENT() macro is defined in a LTTng-UST header file which
must be included:
#include <lttng/tracepoint.h>
This also allows the application to use the tracepoint() macro.
Next is a list of TRACEPOINT_EVENT() macro calls which create the
actual tracepoint definitions. We skip this for the moment and
come back to how to use TRACEPOINT_EVENT()
in a later section. Just pay attention to
the first argument: it’s always the name of the tracepoint provider
being defined in this header file.
End of include guard:
#endif /* _TP_H */
Finally, include <lttng/tracepoint-event.h> to expand the macros:
#include <lttng/tracepoint-event.h>
That’s it for tp.h. Of course, this is only a header file; it must be
included in some C source file to actually use it. This is the job of
tp.c:
#define TRACEPOINT_CREATE_PROBES

#include "tp.h"
When TRACEPOINT_CREATE_PROBES is defined, the macros used in tp.h,
which is included just after, actually create the source code for
LTTng-UST probes (global data structures and functions) out of your
tracepoint definitions. How exactly this is done is out of this text’s scope.
TRACEPOINT_CREATE_PROBES is discussed further
in
Building/linking tracepoint providers and the user application.
You could include other header files like tp.h here to create the probes
of different tracepoint providers, for example:
#define TRACEPOINT_CREATE_PROBES

#include "tp1.h"
#include "tp2.h"
The rule is: probes of a given tracepoint provider
must be created in exactly one source file. This source file could be one
of your project’s; it doesn’t have to be on its own like
tp.c, although
a later section
shows that doing so allows packaging the tracepoint providers
independently and keep them out of your application, also making it
possible to reuse them between projects.
The following sections explain how to define tracepoints, how to use the
tracepoint() macro to instrument your user space C application and how
to build/link tracepoint providers and your application with LTTng-UST
support.
Using lttng-gen-tp
LTTng-UST ships with lttng-gen-tp, a handy command line utility for
generating most of the stuff discussed above. It takes a template file,
with a name usually ending with the .tp extension, containing only
tracepoint definitions, and outputs a tracepoint provider (either a C
source file or a precompiled object file) with its header file.
lttng-gen-tp should suffice in static linking
situations. When using it, write a template file containing a list of
TRACEPOINT_EVENT() macro calls. The tool finds the provider names
used and generate the appropriate files which are going to look a lot
like tp.h and tp.c above.
Just call lttng-gen-tp like this:
lttng-gen-tp my-template.tp
my-template.c, my-template.o and my-template.h
are created in the same directory.
You may specify custom C flags passed to the compiler invoked by
lttng-gen-tp using the CFLAGS environment variable:
CFLAGS=-I/custom/include/path lttng-gen-tp my-template.tp
For more information on lttng-gen-tp, see lttng-gen-tp(1).
Defining tracepoints
As written in Tracepoint provider,
tracepoints are defined using the
TRACEPOINT_EVENT() macro. Each tracepoint, when called using the
tracepoint() macro in the actual application’s source code, generates
a specific event type with its own fields.
Let’s have another look at the example above, with a few added comments:
TRACEPOINT_EVENT(
    /* tracepoint provider name */
    my_provider,

    /* tracepoint/event name */
    my_first_tracepoint,

    /* list of tracepoint arguments */
    TP_ARGS(
        int, my_integer_arg,
        char*, my_string_arg
    ),

    /* list of fields of eventual event  */
    TP_FIELDS(
        ctf_string(my_string_field, my_string_arg)
        ctf_integer(int, my_integer_field, my_integer_arg)
    )
)
The tracepoint provider name must match the name of the tracepoint
provider in which this tracepoint is defined
(see Tracepoint provider). In other words,
always use the same string as the value of TRACEPOINT_PROVIDER above.
The tracepoint name becomes the event name once events are recorded by the LTTng-UST tracer. It must follow the tracepoint provider name syntax: start with a letter and contain either letters, numbers or underscores. Two tracepoints under the same provider cannot have the same name. In other words, you cannot overload a tracepoint like you would overload functions and methods in C++/Java.
Note:The concatenation of the tracepoint provider name and the tracepoint name cannot exceed 254 characters. If it does, the instrumented application compiles and runs, but LTTng issues multiple warnings and you could experience serious problems.
The list of tracepoint arguments gives this tracepoint its signature:
see it like the declaration of a C function. The format of TP_ARGS()
arguments is: C type, then argument name; repeat as needed, up to ten
times. For example, if we were to replicate the signature of C standard
library’s fseek(), the TP_ARGS() part would look like:
    TP_ARGS(
        FILE*, stream,
        long int, offset,
        int, origin
    ),
Of course, you need to include appropriate header files before
the TRACEPOINT_EVENT() macro calls if any argument has a complex type.
TP_ARGS() may not be omitted, but may be empty. TP_ARGS(void) is
also accepted.
The list of fields is where the fun really begins. The fields defined in this list are the fields of the events generated by the execution of this tracepoint. Each tracepoint field definition has a C argument expression which is evaluated when the execution reaches the tracepoint. Tracepoint arguments may be used freely in those argument expressions, but they don’t have to.
There are several types of tracepoint fields available. The macros to define them are given and explained in the LTTng-UST library reference section.
Field names must follow the standard C identifier syntax: letter, then optional sequence of letters, numbers or underscores. Each field must have a different name.
Those ctf_*() macros are added to the TP_FIELDS() part of
TRACEPOINT_EVENT(). Note that they are not delimited by commas.
TP_FIELDS() may be empty, but the TP_FIELDS(void) form is not
accepted.
The following snippet shows how argument expressions may be used in tracepoint fields and how they may refer freely to tracepoint arguments.
/* for struct stat */
#include <sys/types.h>
#include <sys/stat.h>
#include <unistd.h>

TRACEPOINT_EVENT(
    my_provider,
    my_tracepoint,
    TP_ARGS(
        int, my_int_arg,
        char*, my_str_arg,
        struct stat*, st
    ),
    TP_FIELDS(
        /* simple integer field with constant value */
        ctf_integer(
            int,                    /* field C type */
            my_constant_field,      /* field name */
            23 + 17                 /* argument expression */
        )

        /* my_int_arg tracepoint argument */
        ctf_integer(
            int,
            my_int_arg_field,
            my_int_arg
        )

        /* my_int_arg squared */
        ctf_integer(
            int,
            my_int_arg_field2,
            my_int_arg * my_int_arg
        )

        /* sum of first 4 characters of my_str_arg */
        ctf_integer(
            int,
            sum4,
            my_str_arg[0] + my_str_arg[1] +
            my_str_arg[2] + my_str_arg[3]
        )

        /* my_str_arg as string field */
        ctf_string(
            my_str_arg_field,       /* field name */
            my_str_arg              /* argument expression */
        )

        /* st_size member of st tracepoint argument, hexadecimal */
        ctf_integer_hex(
            off_t,                  /* field C type */
            size_field,             /* field name */
            st->st_size             /* argument expression */
        )

        /* st_size member of st tracepoint argument, as double */
        ctf_float(
            double,                 /* field C type */
            size_dbl_field,         /* field name */
            (double) st->st_size    /* argument expression */
        )

        /* half of my_str_arg string as text sequence */
        ctf_sequence_text(
            char,                   /* element C type */
            half_my_str_arg_field,  /* field name */
            my_str_arg,             /* argument expression */
            size_t,                 /* length expression C type */
            strlen(my_str_arg) / 2  /* length expression */
        )
    )
)
As you can see, having a custom argument expression for each field makes tracepoints very flexible for tracing a user space C application. This tracepoint definition is reused later in this guide, when actually using tracepoints in a user space application.
Using tracepoint classes
In LTTng-UST, a tracepoint class is a class of tracepoints sharing the same field types and names. A tracepoint instance is one instance of such a declared tracepoint class, with its own event name and tracepoint provider name.
What is documented in Defining tracepoints is actually how to declare a tracepoint class and define a tracepoint instance at the same time. Without revealing the internals of LTTng-UST too much, it has to be noted that one serialization function is created for each tracepoint class. A serialization function is responsible for serializing the fields of a tracepoint into a sub-buffer when tracing. For various performance reasons, when your situation requires multiple tracepoints with different names, but with the same fields layout, the best practice is to manually create a tracepoint class and instantiate as many tracepoint instances as needed. One positive effect of such a design, amongst other advantages, is that all tracepoint instances of the same tracepoint class reuse the same serialization function, thus reducing cache pollution.
As an example, here are three tracepoint definitions as we know them:
TRACEPOINT_EVENT(
    my_app,
    get_account,
    TP_ARGS(
        int, userid,
        size_t, len
    ),
    TP_FIELDS(
        ctf_integer(int, userid, userid)
        ctf_integer(size_t, len, len)
    )
)

TRACEPOINT_EVENT(
    my_app,
    get_settings,
    TP_ARGS(
        int, userid,
        size_t, len
    ),
    TP_FIELDS(
        ctf_integer(int, userid, userid)
        ctf_integer(size_t, len, len)
    )
)

TRACEPOINT_EVENT(
    my_app,
    get_transaction,
    TP_ARGS(
        int, userid,
        size_t, len
    ),
    TP_FIELDS(
        ctf_integer(int, userid, userid)
        ctf_integer(size_t, len, len)
    )
)
In this case, three tracepoint classes are created, with one tracepoint
instance for each of them: get_account, get_settings and
get_transaction. However, they all share the same field names and
types. Declaring one tracepoint class and three tracepoint instances of
the latter is a better design choice:
/* the tracepoint class */
TRACEPOINT_EVENT_CLASS(
    /* tracepoint provider name */
    my_app,

    /* tracepoint class name */
    my_class,

    /* arguments */
    TP_ARGS(
        int, userid,
        size_t, len
    ),

    /* fields */
    TP_FIELDS(
        ctf_integer(int, userid, userid)
        ctf_integer(size_t, len, len)
    )
)

/* the tracepoint instances */
TRACEPOINT_EVENT_INSTANCE(
    /* tracepoint provider name */
    my_app,

    /* tracepoint class name */
    my_class,

    /* tracepoint/event name */
    get_account,

    /* arguments */
    TP_ARGS(
        int, userid,
        size_t, len
    )
)
TRACEPOINT_EVENT_INSTANCE(
    my_app,
    my_class,
    get_settings,
    TP_ARGS(
        int, userid,
        size_t, len
    )
)
TRACEPOINT_EVENT_INSTANCE(
    my_app,
    my_class,
    get_transaction,
    TP_ARGS(
        int, userid,
        size_t, len
    )
)
Of course, all those names and TP_ARGS() invocations are redundant,
but some C preprocessor magic can solve this:
#define MY_TRACEPOINT_ARGS \
    TP_ARGS( \
        int, userid, \
        size_t, len \
    )

TRACEPOINT_EVENT_CLASS(
    my_app,
    my_class,
    MY_TRACEPOINT_ARGS,
    TP_FIELDS(
        ctf_integer(int, userid, userid)
        ctf_integer(size_t, len, len)
    )
)

#define MY_APP_TRACEPOINT_INSTANCE(name) \
    TRACEPOINT_EVENT_INSTANCE( \
        my_app, \
        my_class, \
        name, \
        MY_TRACEPOINT_ARGS \
    )

MY_APP_TRACEPOINT_INSTANCE(get_account)
MY_APP_TRACEPOINT_INSTANCE(get_settings)
MY_APP_TRACEPOINT_INSTANCE(get_transaction)
Assigning log levels to tracepoints
Optionally, a log level can be assigned to a defined tracepoint. Assigning different levels of importance to tracepoints can be useful; when controlling tracing sessions, you can choose to only enable tracepoints falling into a specific log level range.
Log levels are assigned to defined tracepoints using the
TRACEPOINT_LOGLEVEL() macro. The latter must be used after having
used TRACEPOINT_EVENT() for a given tracepoint. The
TRACEPOINT_LOGLEVEL() macro has the following construct:
TRACEPOINT_LOGLEVEL(PROVIDER_NAME, TRACEPOINT_NAME, LOG_LEVEL)
where the first two arguments are the same as the first two arguments
of TRACEPOINT_EVENT() and LOG_LEVEL is one
of the values given in the
LTTng-UST library reference
section.
As an example, let’s assign a TRACE_DEBUG_UNIT log level to our
previous tracepoint definition:
TRACEPOINT_LOGLEVEL(my_provider, my_tracepoint, TRACE_DEBUG_UNIT)
Probing the application’s source code
Once tracepoints are properly defined within a tracepoint provider,
they may be inserted into the user application to be instrumented
using the tracepoint() macro. Its first argument is the tracepoint
provider name and its second is the tracepoint name. The next, optional
arguments are defined by the TP_ARGS() part of the definition of
the tracepoint to use.
As an example, let us again take the following tracepoint definition:
TRACEPOINT_EVENT(
    /* tracepoint provider name */
    my_provider,

    /* tracepoint/event name */
    my_first_tracepoint,

    /* list of tracepoint arguments */
    TP_ARGS(
        int, my_integer_arg,
        char*, my_string_arg
    ),

    /* list of fields of eventual event  */
    TP_FIELDS(
        ctf_string(my_string_field, my_string_arg)
        ctf_integer(int, my_integer_field, my_integer_arg)
    )
)
Assuming this is part of a file named tp.h which defines the tracepoint
provider and which is included by tp.c, here’s a complete C application
calling this tracepoint (multiple times):
#define TRACEPOINT_DEFINE
#include "tp.h"

int main(int argc, char* argv[])
{
    int i;

    tracepoint(my_provider, my_first_tracepoint, 23, "Hello, World!");

    for (i = 0; i < argc; ++i) {
        tracepoint(my_provider, my_first_tracepoint, i, argv[i]);
    }

    return 0;
}
For each tracepoint provider, TRACEPOINT_DEFINE must be defined into
exactly one translation unit (C source file) of the user application,
before including the tracepoint provider header file. In other words,
for a given tracepoint provider, you cannot define TRACEPOINT_DEFINE,
and then include its header file in two separate C source files of
the same application. TRACEPOINT_DEFINE is discussed further in
Building/linking tracepoint providers and the user application.
As another example, remember this definition we wrote in a previous section (comments are stripped):
/* for struct stat */
#include <sys/types.h>
#include <sys/stat.h>
#include <unistd.h>

TRACEPOINT_EVENT(
    my_provider,
    my_tracepoint,
    TP_ARGS(
        int, my_int_arg,
        char*, my_str_arg,
        struct stat*, st
    ),
    TP_FIELDS(
        ctf_integer(int, my_constant_field, 23 + 17)
        ctf_integer(int, my_int_arg_field, my_int_arg)
        ctf_integer(int, my_int_arg_field2, my_int_arg * my_int_arg)
        ctf_integer(int, sum4_field, my_str_arg[0] + my_str_arg[1] +
                                     my_str_arg[2] + my_str_arg[3])
        ctf_string(my_str_arg_field, my_str_arg)
        ctf_integer_hex(off_t, size_field, st->st_size)
        ctf_float(double, size_dbl_field, (double) st->st_size)
        ctf_sequence_text(char, half_my_str_arg_field, my_str_arg,
                          size_t, strlen(my_str_arg) / 2)
    )
)
Here’s an example of calling it:
#define TRACEPOINT_DEFINE
#include "tp.h"

int main(void)
{
    struct stat s;

    stat("/etc/fstab", &s);

    tracepoint(my_provider, my_tracepoint, 23, "Hello, World!", &s);

    return 0;
}
When viewing the trace, assuming the file size of /etc/fstab is
301 bytes, the event generated by the execution of this tracepoint
should have the following fields, in this order:
my_constant_field           40
my_int_arg_field            23
my_int_arg_field2           529
sum4_field                  389
my_str_arg_field            "Hello, World!"
size_field                  0x12d
size_dbl_field              301.0
half_my_str_arg_field       "Hello,"
Building/linking tracepoint providers and the user application
The final step of using LTTng-UST for tracing a user space C application (beside running the application) is building and linking tracepoint providers and the application itself.
As discussed above, the macros used by the user-written tracepoint provider
header file are useless until actually used to create probes code
(global data structures and functions) in a translation unit (C source file).
This is accomplished by defining TRACEPOINT_CREATE_PROBES in a translation
unit and then including the tracepoint provider header file.
When TRACEPOINT_CREATE_PROBES is defined, macros used and included by
the tracepoint provider header produce actual source code needed by any
application using the defined tracepoints. Defining
TRACEPOINT_CREATE_PROBES produces code used when registering
tracepoint providers when the tracepoint provider package loads.
The other important definition is TRACEPOINT_DEFINE. This one creates
global, per-tracepoint structures referencing the tracepoint providers
data. Those structures are required by the actual functions inserted
where tracepoint() macros are placed and need to be defined by the
instrumented application.
Both TRACEPOINT_CREATE_PROBES and TRACEPOINT_DEFINE need to be defined
at some places in order to trace a user space C application using LTTng.
Although explaining their exact mechanism is beyond the scope of this
document, the reason they both exist separately is to allow the trace
providers to be packaged as a shared object (dynamically loaded library).
There are two ways to compile and link the tracepoint providers with the application: statically or dynamically. Both methods are covered in the following subsections.
Static linking the tracepoint providers to the application
With the static linking method, compiled tracepoint providers are copied into the target application. There are three ways to do this:
-
Use one of your existing C source files to create probes.
-
Create probes in a separate C source file and build it as an object file to be linked with the application (more decoupled).
-
Create probes in a separate C source file, build it as an object file and archive it to create a static library (more decoupled, more portable).
The first approach is to define TRACEPOINT_CREATE_PROBES and include
your tracepoint provider(s) header file(s) directly into an existing C
source file. Here’s an example:
#include <stdlib.h>
#include <stdio.h>
/* ... */

#define TRACEPOINT_CREATE_PROBES
#define TRACEPOINT_DEFINE
#include "tp.h"

/* ... */

int my_func(int a, const char* b)
{
    /* ... */

    tracepoint(my_provider, my_tracepoint, buf, sz, limit, &tt)

    /* ... */
}

/* ... */
Again, before including a given tracepoint provider header file,
TRACEPOINT_CREATE_PROBES and TRACEPOINT_DEFINE must be defined in
one, and only one, translation unit. Other C source files of the
same application may include tp.h to use tracepoints with
the tracepoint() macro, but must not define
TRACEPOINT_CREATE_PROBES/TRACEPOINT_DEFINE again.
This translation unit may be built as an object file by making sure to
add . to the include path:
gcc -c -I. file.c
The second approach is to isolate the tracepoint provider code into a separate object file by using a dedicated C source file to create probes:
#define TRACEPOINT_CREATE_PROBES

#include "tp.h"
TRACEPOINT_DEFINE must be defined by a translation unit of the
application. Since we’re talking about static linking here, it could as
well be defined directly in the file above, before #include "tp.h":
#define TRACEPOINT_CREATE_PROBES
#define TRACEPOINT_DEFINE

#include "tp.h"
This is actually what lttng-gen-tp does, and is
the recommended practice.
Build the tracepoint provider:
gcc -c -I. tp.c
Finally, the resulting object file may be archived to create a more portable tracepoint provider static library:
ar rc tp.a tp.o
Using a static library does have the advantage of centralising the tracepoint providers objects so they can be shared between multiple applications. This way, when the tracepoint provider is modified, the source code changes don’t have to be patched into each application’s source code tree. The applications need to be relinked after each change, but need not to be otherwise recompiled (unless the tracepoint provider’s API changes).
Regardless of which method you choose, you end up with an object file
(potentially archived) containing the trace providers assembled code.
To link this code with the rest of your application, you must also link
with liblttng-ust and libdl:
gcc -o app tp.o other.o files.o of.o your.o app.o -llttng-ust -ldl
or
gcc -o app tp.a other.o files.o of.o your.o app.o -llttng-ust -ldl
If you’re using a BSD
system, replace -ldl with -lc:
gcc -o app tp.a other.o files.o of.o your.o app.o -llttng-ust -lc
The application can be started as usual, for example:
./app
The lttng command line tool can be used to
control tracing.
Dynamic linking the tracepoint providers to the application
The second approach to package the tracepoint providers is to use
dynamic linking: the library and its member functions are explicitly
sought, loaded and unloaded at runtime using libdl.
It has to be noted that, for a variety of reasons, the created shared
library is be dynamically loaded, as opposed to dynamically
linked. The tracepoint provider shared object is, however, linked
with liblttng-ust, so that liblttng-ust is guaranteed to be loaded
as soon as the tracepoint provider is. If the tracepoint provider is
not loaded, since the application itself is not linked with
liblttng-ust, the latter is not loaded at all and the tracepoint calls
become inert.
The process to create the tracepoint provider shared object is pretty much the same as the static library method, except that:
-
since the tracepoint provider is not part of the application anymore,
TRACEPOINT_DEFINEmust be defined, for each tracepoint provider, in exactly one translation unit (C source file) of the application; -
TRACEPOINT_PROBE_DYNAMIC_LINKAGEmust be defined next toTRACEPOINT_DEFINE.
Regarding TRACEPOINT_DEFINE and TRACEPOINT_PROBE_DYNAMIC_LINKAGE,
the recommended practice is to use a separate C source file in your
application to define them, then include the tracepoint provider
header files afterwards. For example:
#define TRACEPOINT_DEFINE
#define TRACEPOINT_PROBE_DYNAMIC_LINKAGE

/* include the header files of one or more tracepoint providers below */
#include "tp1.h"
#include "tp2.h"
#include "tp3.h"
TRACEPOINT_PROBE_DYNAMIC_LINKAGE makes the macros included afterwards
(by including the tracepoint provider header, which itself includes
LTTng-UST headers) aware that the tracepoint provider is to be loaded
dynamically and not part of the application’s executable.
The tracepoint provider object file used to create the shared library
is built like it is using the static library method, only with the
-fpic option added:
gcc -c -fpic -I. tp.c
It is then linked as a shared library like this:
gcc -shared -Wl,--no-as-needed -o tp.so -llttng-ust tp.o
As previously stated, this tracepoint provider shared object isn’t
linked with the user application: it’s loaded manually. This is
why the application is built with no mention of this tracepoint
provider, but still needs libdl:
gcc -o app other.o files.o of.o your.o app.o -ldl
Now, to make LTTng-UST tracing available to the application, the
LD_PRELOAD environment variable is used to preload the tracepoint
provider shared library before the application actually starts:
LD_PRELOAD=/path/to/tp.so ./app
Note:It is not safe to use
dlclose() on a tracepoint provider shared object that
is being actively used for tracing, due to a lack of reference
counting from LTTng-UST to the shared object.
For example, statically linking a tracepoint provider to a
shared object which is to be dynamically loaded by an application
(a plugin, for example) is not safe: the shared object, which
contains the tracepoint provider, could be dynamically closed
(dlclose()) at any time by the application.
To instrument a shared object, either:
-
Statically link the tracepoint provider to the application, or
-
Build the tracepoint provider as a shared object (following the procedure shown in this section), and preload it when tracing is needed using the
LD_PRELOADenvironment variable.
Your application will still work without this preloading, albeit without LTTng-UST tracing support:
./app
Using LTTng-UST with daemons
Some extra care is needed when using liblttng-ust with daemon
applications that call fork(), clone() or BSD’s rfork() without
a following exec() family system call. The liblttng-ust-fork
library must be preloaded for the application.
Example:
LD_PRELOAD=liblttng-ust-fork.so ./app
Or, if you’re using a tracepoint provider shared library:
LD_PRELOAD="liblttng-ust-fork.so /path/to/tp.so" ./app
Using pkg-config
On some distributions, LTTng-UST is shipped with a pkg-config metadata
file, so that you may use the pkg-config tool:
pkg-config --libs lttng-ust
This prints -llttng-ust -ldl on Linux systems.
You may also check the LTTng-UST version using pkg-config:
pkg-config --modversion lttng-ust
For more information about pkg-config, see its manpage.
Using tracef()
tracef() is a small LTTng-UST API to avoid defining your own
tracepoints and tracepoint providers. The signature of tracef() is
the same as printf()'s.
The tracef() utility function was developed to make user space tracing
super simple, albeit with notable disadvantages compared to custom,
full-fledged tracepoint providers:
-
All generated events have the same provider/event names, respectively
lttng_ust_tracefandevent. -
There’s no static type checking.
-
The only event field you actually get, named
msg, is a string potentially containing the values you passed to the function using your own format. This also means that you cannot use filtering using a custom expression at runtime because there are no isolated fields. -
Since
tracef()uses C standard library’svasprintf()function in the background to format the strings at runtime, its expected performance is lower than using custom tracepoint providers with typed fields, which do not require a conversion to a string.
Thus, tracef() is useful for quick prototyping and debugging, but
should not be considered for any permanent/serious application
instrumentation.
To use tracef(), first include <lttng/tracef.h> in the C source file
where you need to insert probes:
#include <lttng/tracef.h>
Use tracef() like you would use printf() in your source code, for
example:
    /* ... */

    tracef("my message, my integer: %d", my_integer);

    /* ... */
Link your application with liblttng-ust:
gcc -o app app.c -llttng-ust
Execute the application as usual:
./app
Voilà! Use the lttng command line tool to
control tracing. You can enable tracef()
events like this:
lttng enable-event --userspace 'lttng_ust_tracef:*'
LTTng-UST environment variables and special compilation flags
A few special environment variables and compile flags may affect the behavior of LTTng-UST.
LTTng-UST’s debugging can be activated by setting the environment
variable LTTNG_UST_DEBUG to 1 when launching the application. It
can also be enabled at compile time by defining LTTNG_UST_DEBUG when
compiling LTTng-UST (using the -DLTTNG_UST_DEBUG compiler option).
The environment variable LTTNG_UST_REGISTER_TIMEOUT can be used to
specify how long the application should wait for the
session daemon's registration done command
before proceeding to execute the main program. The timeout value is
specified in milliseconds. 0 means don’t wait. -1 means
wait forever. Setting this environment variable to 0 is recommended
for applications with time contraints on the process startup time.
The default value of LTTNG_UST_REGISTER_TIMEOUT (when not defined)
is 3000 ms.
The compilation definition LTTNG_UST_DEBUG_VALGRIND should be enabled
at build time (-DLTTNG_UST_DEBUG_VALGRIND) to allow liblttng-ust
to be used with Valgrind.
The side effect of defining LTTNG_UST_DEBUG_VALGRIND is that per-CPU
buffering is disabled.
C++ application
Because of C++'s cross-compatibility with the C language, C++ applications can be readily instrumented with the LTTng-UST C API.
Follow the C application user guide above. It
should be noted that, in this case, tracepoint providers should have
the typical .cpp, .cxx or .cc extension and be built with g++
instead of gcc. This is the easiest way of avoiding linking errors
due to symbol name mangling incompatibilities between both languages.
Prebuilt user space tracing helpers
The LTTng-UST package provides a few helpers that one may find
useful in some situations. They all work the same way: you must
preload the appropriate shared object before running the user
application (using the LD_PRELOAD environment variable).
The shared objects are normally found in /usr/lib.
The current installed helpers are:
-
liblttng-ust-libc-wrapper.soandliblttng-ust-pthread-wrapper.so -
liblttng-ust-cyg-profile.soandliblttng-ust-cyg-profile-fast.so -
liblttng-ust-dl.so
The following subsections document what helpers instrument exactly and how to use them.
C standard library and POSIX threads tracing
liblttng-ust-libc-wrapper.so and liblttng-ust-pthread-wrapper.so
can add instrumentation to respectively some C standard library and
POSIX threads functions.
The following functions are traceable by liblttng-ust-libc-wrapper.so:
Functions instrumented by liblttng-ust-libc-wrapper.so
| TP provider name | TP name | Instrumented function |
|---|---|---|
|
|
|
|
| |
|
| |
|
| |
|
| |
|
|
The following functions are traceable by
liblttng-ust-pthread-wrapper.so:
Functions instrumented by liblttng-ust-pthread-wrapper.so
| TP provider name | TP name | Instrumented function |
|---|---|---|
|
|
|
|
| |
|
| |
|
|
All tracepoints have fields corresponding to the arguments of the function they instrument.
To use one or the other with any user application, independently of how the latter is built, do:
LD_PRELOAD=liblttng-ust-libc-wrapper.so my-app
or
LD_PRELOAD=liblttng-ust-pthread-wrapper.so my-app
To use both, do:
LD_PRELOAD="liblttng-ust-libc-wrapper.so liblttng-ust-pthread-wrapper.so" my-app
When the shared object is preloaded, it effectively replaces the functions listed in the above tables by wrappers which add tracepoints and call the replaced functions.
Of course, like any other tracepoint, the ones above need to be enabled
in order for LTTng-UST to generate events. This is done using the
lttng command line tool
(see Controlling tracing).
Function tracing
Function tracing is the recording of which functions are entered and left during the execution of an application. Like with any LTTng event, the precise time at which this happens is also kept.
GCC and clang have an option named
-finstrument-functions
which generates instrumentation calls for entry and exit to functions.
The LTTng-UST function tracing helpers, liblttng-ust-cyg-profile.so
and liblttng-ust-cyg-profile-fast.so, take advantage of this feature
to add instrumentation to the two generated functions (which contain
cyg_profile in their names, hence the shared object’s name).
In order to use LTTng-UST function tracing, the translation units to
instrument must be built using the -finstrument-functions compiler
flag.
LTTng-UST function tracing comes in two flavors, each providing
different trade-offs: liblttng-ust-cyg-profile-fast.so and
liblttng-ust-cyg-profile.so.
liblttng-ust-cyg-profile-fast.so is a lightweight variant that
should only be used where it can be guaranteed that the complete event
stream is recorded without any missing events. Any kind of duplicate
information is left out. This version registers the following
tracepoints:
Functions instrumented by liblttng-ust-cyg-profile-fast.so
| TP provider name | TP name | Instrumented function |
|---|---|---|
|
| Function entry
|
| Function exit |
Assuming no event is lost, having only the function addresses on entry
is enough for creating a call graph (remember that a recorded event
always contains the ID of the CPU that generated it). A tool like
addr2line
may be used to convert function addresses back to source files names
and line numbers.
The other helper,
liblttng-ust-cyg-profile.so,
is a more robust variant which also works for use cases where
events might get discarded or not recorded from application startup.
In these cases, the trace analyzer needs extra information to be
able to reconstruct the program flow. This version registers the
following tracepoints:
Functions instrumented by liblttng-ust-cyg-profile.so
| TP provider name | TP name | Instrumented function |
|---|---|---|
|
| Function entry
|
| Function exit
|
To use one or the other variant with any user application, assuming at
least one translation unit of the latter is compiled with the
-finstrument-functions option, do:
LD_PRELOAD=liblttng-ust-cyg-profile-fast.so my-app
or
LD_PRELOAD=liblttng-ust-cyg-profile.so my-app
It might be necessary to limit the number of source files where
-finstrument-functions is used to prevent excessive amount of trace
data to be generated at runtime.
Tip:When using GCC, at least, you can use
the -finstrument-functions-exclude-function-list
option to avoid instrumenting entries and exits of specific
symbol names.
All events generated from LTTng-UST function tracing are provided on
log level TRACE_DEBUG_FUNCTION, which is useful to easily enable
function tracing events in your tracing session using the
--loglevel-only option of lttng enable-event
(see Controlling tracing).
Dynamic linker tracing
This LTTng-UST helper causes all calls to dlopen() and dlclose()
in the target application to be traced with LTTng.
The helper’s shared object, liblttng-ust-dl.so, registers the
following tracepoints when preloaded:
Functions instrumented by liblttng-ust-dl.so
| TP provider name | TP name | Instrumented function |
|---|---|---|
|
|
|
| Function exit
|
To use this LTTng-UST helper with any user application, independently of how the latter is built, do:
LD_PRELOAD=liblttng-ust-dl.so my-app
Of course, like any other tracepoint, the ones above need to be enabled
in order for LTTng-UST to generate events. This is done using the
lttng command line tool
(see Controlling tracing).
Java application
LTTng-UST provides a logging back-end for Java applications using either
java.util.logging
(JUL) or
Apache log4j 1.2
This back-end is called the LTTng-UST Java agent, and it is responsible
for the communications with an LTTng session daemon.
From the user’s point of view, once the LTTng-UST Java agent has been initialized, JUL and log4j loggers may be created and used as usual. The agent adds its own handler to the root logger, so that all loggers may generate LTTng events with no effort.
Common JUL/log4j features are supported using the lttng tool
(see Controlling tracing):
-
listing all logger names
-
enabling/disabling events per logger name
-
JUL/log4j log levels
java.util.logging
Here’s an example of tracing a Java application which is using
java.util.logging:
import java.util.logging.Logger;
import org.lttng.ust.agent.LTTngAgent;

public class Test
{
    private static final int answer = 42;

    public static void main(String[] argv) throws Exception
    {
        // create a logger
        Logger logger = Logger.getLogger("jello");

        // call this as soon as possible (before logging)
        LTTngAgent lttngAgent = LTTngAgent.getLTTngAgent();

        // log at will!
        logger.info("some info");
        logger.warning("some warning");
        Thread.sleep(500);
        logger.finer("finer information; the answer is " + answer);
        Thread.sleep(123);
        logger.severe("error!");

        // not mandatory, but cleaner
        lttngAgent.dispose();
    }
}
The LTTng-UST Java agent is packaged in a JAR file named
liblttng-ust-agent.jar It is typically located in
/usr/lib/lttng/java. To compile the snippet above
(saved as Test.java), do:
javac -cp /usr/lib/lttng/java/liblttng-ust-agent.jar Test.java
You can run the resulting compiled class like this:
java -cp /usr/lib/lttng/java/liblttng-ust-agent.jar:. Test
Note:OpenJDK 7 is used for development and continuous integration, thus this version is directly supported. However, the LTTng-UST Java agent has also been tested with OpenJDK 6.
Apache log4j 1.2
LTTng features an Apache log4j 1.2 agent, which means your existing Java applications using log4j 1.2 for logging can record events to LTTng traces with just a minor source code modification.
Note:This version of LTTng does not support Log4j 2.
Here’s an example:
import org.apache.log4j.Logger;
import org.apache.log4j.BasicConfigurator;
import org.lttng.ust.agent.LTTngAgent;

public class Test
{
    private static final int answer = 42;

    public static void main(String[] argv) throws Exception
    {
        // create and configure a logger
        Logger logger = Logger.getLogger(Test.class);
        BasicConfigurator.configure();

        // call this as soon as possible (before logging)
        LTTngAgent lttngAgent = LTTngAgent.getLTTngAgent();

        // log at will!
        logger.info("some info");
        logger.warn("some warning");
        Thread.sleep(500);
        logger.debug("debug information; the answer is " + answer);
        Thread.sleep(123);
        logger.error("error!");
        logger.fatal("fatal error!");

        // not mandatory, but cleaner
        lttngAgent.dispose();
    }
}
To compile the snippet above, do:
javac -cp /usr/lib/lttng/java/liblttng-ust-agent.jar:$LOG4JCP Test.java
where $LOG4JCP is the log4j 1.2 JAR file path.
You can run the resulting compiled class like this:
java -cp /usr/lib/lttng/java/liblttng-ust-agent.jar:$LOG4JCP:. Test
Linux kernel
The Linux kernel can be instrumented for LTTng tracing, either its core source code or a kernel module. It has to be noted that Linux is readily traceable using LTTng since many parts of its source code are already instrumented: this is the job of the upstream LTTng-modules package. This section presents how to add LTTng instrumentation where it does not currently exist and how to instrument custom kernel modules.
All LTTng instrumentation in the Linux kernel is based on an existing
infrastructure which bears the name of its main macro, TRACE_EVENT().
This macro is used to define tracepoints,
each tracepoint having a name, usually with the
subsys_name format,
subsys being the subsystem name and
name the specific event name.
Tracepoints defined with TRACE_EVENT() may be inserted anywhere in
the Linux kernel source code, after what callbacks, called probes,
may be registered to execute some action when a tracepoint is
executed. This mechanism is directly used by ftrace and perf,
but cannot be used as is by LTTng: an adaptation layer is added to
satisfy LTTng’s specific needs.
With that in mind, this documentation does not cover the TRACE_EVENT()
format and how to use it, but it is mandatory to understand it and use
it to instrument Linux for LTTng. A series of
LWN articles explain
TRACE_EVENT() in details:
part 1,
part 2, and
part 3.
Once you master TRACE_EVENT() enough for your use case, continue
reading this section so that you can add the LTTng adaptation layer of
instrumentation.
This section first discusses the general method of instrumenting the Linux kernel for LTTng. This method is then reused for the specific case of instrumenting a kernel module.
Instrumenting the Linux kernel for LTTng
The following subsections explain strictly how to add custom LTTng instrumentation to the Linux kernel. They do not explain how the macros actually work and the internal mechanics of the tracer.
You should have a Linux kernel source code tree to work with. Throughout this section, all file paths are relative to the root of this tree unless otherwise stated.
You need a copy of the LTTng-modules Git repository:
git clone git://git.lttng.org/lttng-modules.git
The steps to add custom LTTng instrumentation to a Linux kernel
involves defining and using the mainline TRACE_EVENT() tracepoints
first, then writing and using the LTTng adaptation layer.
Defining/using tracepoints with mainline TRACE_EVENT() infrastructure
The first step is to define tracepoints using the mainline Linux
TRACE_EVENT() macro and insert tracepoints where you want them.
Your tracepoint definitions reside in a header file in
include/trace/events. If you’re adding tracepoints to an existing
subsystem, edit its appropriate header file.
As an example, the following header file (let’s call it
include/trace/events/hello.h) defines one tracepoint using
TRACE_EVENT():
/* subsystem name is "hello" */
#undef TRACE_SYSTEM
#define TRACE_SYSTEM hello

#if !defined(_TRACE_HELLO_H) || defined(TRACE_HEADER_MULTI_READ)
#define _TRACE_HELLO_H

#include <linux/tracepoint.h>

TRACE_EVENT(
    /* "hello" is the subsystem name, "world" is the event name */
    hello_world,

    /* tracepoint function prototype */
    TP_PROTO(int foo, const char* bar),

    /* arguments for this tracepoint */
    TP_ARGS(foo, bar),

    /* LTTng doesn't need those */
    TP_STRUCT__entry(),
    TP_fast_assign(),
    TP_printk("", 0)
);

#endif

/* this part must be outside protection */
#include <trace/define_trace.h>
Notice that we don’t use any of the last three arguments: they
are left empty here because LTTng doesn’t need them. You would only fill
TP_STRUCT__entry(), TP_fast_assign() and TP_printk() if you were
to also use this tracepoint for ftrace/perf.
Once this is done, you may place calls to trace_hello_world()
wherever you want in the Linux source code. As an example, let us place
such a tracepoint in the usb_probe_device() static function
(drivers/usb/core/driver.c):
/* called from driver core with dev locked */
static int usb_probe_device(struct device *dev)
{
    struct usb_device_driver *udriver = to_usb_device_driver(dev->driver);
    struct usb_device *udev = to_usb_device(dev);
    int error = 0;

    trace_hello_world(udev->devnum, udev->product);

    /* ... */
}
This tracepoint should fire every time a USB device is plugged in.
At the top of driver.c, we need to include our actual tracepoint
definition and, in this case (one place per subsystem), define
CREATE_TRACE_POINTS, which creates our tracepoint:
/* ... */

#include "usb.h"

#define CREATE_TRACE_POINTS
#include <trace/events/hello.h>

/* ... */
Build your custom Linux kernel. In order to use LTTng, make sure the following kernel configuration options are enabled:
-
CONFIG_MODULES(loadable module support) -
CONFIG_KALLSYMS(load all symbols for debugging/kksymoops) -
CONFIG_HIGH_RES_TIMERS(high resolution timer support) -
CONFIG_TRACEPOINTS(kernel tracepoint instrumentation)
Boot the custom kernel. The directory
/sys/kernel/debug/tracing/events/hello should exist if everything
Adding the LTTng adaptation layer
The steps to write the LTTng adaptation layer are, in your LTTng-modules copy’s source code tree:
-
In
instrumentation/events/lttng-module, add a headersubsys.hfor your custom subsystemsubsysand write your tracepoint definitions using LTTng-modules macros in it. Those macros look like the mainline kernel equivalents, but they present subtle, yet important differences. -
module for your subsystem. It should be named
lttng-probe-subsys.c. -
Edit
probes/Makefileso that the LTTng-modules project builds your custom LTTng probe kernel module. -
Build and install LTTng kernel modules.
Following our hello_world event example, here’s the content of
instrumentation/events/lttng-module/hello.h:
#undef TRACE_SYSTEM
#define TRACE_SYSTEM hello

#if !defined(_TRACE_HELLO_H) || defined(TRACE_HEADER_MULTI_READ)
#define _TRACE_HELLO_H

#include "../../../probes/lttng-tracepoint-event.h"
#include <linux/tracepoint.h>

LTTNG_TRACEPOINT_EVENT(
    /* format identical to mainline version for those */
    hello_world,
    TP_PROTO(int foo, const char* bar),
    TP_ARGS(foo, bar),

    /* possible differences */
    TP_STRUCT__entry(
        __field(int, my_int)
        __field(char, char0)
        __field(char, char1)
        __string(product, bar)
    ),

    /* notice the use of tp_assign()/tp_strcpy() and no semicolons */
    TP_fast_assign(
        tp_assign(my_int, foo)
        tp_assign(char0, bar[0])
        tp_assign(char1, bar[1])
        tp_strcpy(product, bar)
    ),

    /* This one is actually not used by LTTng either, but must be
     * present for the moment.
     */
    TP_printk("", 0)

/* no semicolon after this either */
)

#endif

/* other difference: do NOT include <trace/define_trace.h> */
#include "../../../probes/define_trace.h"
Some possible entries for TP_STRUCT__entry() and TP_fast_assign(),
in the case of LTTng-modules, are shown in the
LTTng-modules reference section.
The best way to learn how to use the above macros is to inspect
existing LTTng tracepoint definitions in
instrumentation/events/lttng-module header files. Compare
them with the Linux kernel mainline versions in
include/trace/events.
The next step is writing the LTTng probe kernel module C source file.
This one is named lttng-probe-subsys.c
#include <linux/module.h>
#include "../lttng-tracer.h"

/* Build time verification of mismatch between mainline TRACE_EVENT()
 * arguments and LTTng adaptation layer LTTNG_TRACEPOINT_EVENT() arguments.
 */
#include <trace/events/hello.h>

/* create LTTng tracepoint probes */
#define LTTNG_PACKAGE_BUILD
#define CREATE_TRACE_POINTS
#define TRACE_INCLUDE_PATH ../instrumentation/events/lttng-module

#include "../instrumentation/events/lttng-module/hello.h"

MODULE_LICENSE("GPL and additional rights");
MODULE_AUTHOR("Your name <your-email>");
MODULE_DESCRIPTION("LTTng hello probes");
MODULE_VERSION(__stringify(LTTNG_MODULES_MAJOR_VERSION) "."
    __stringify(LTTNG_MODULES_MINOR_VERSION) "."
    __stringify(LTTNG_MODULES_PATCHLEVEL_VERSION)
    LTTNG_MODULES_EXTRAVERSION);
Just replace hello with your subsystem name. In this example,
<trace/events/hello.h>, which is the original mainline tracepoint
definition header, is included for verification purposes: the
LTTng-modules build system is able to emit an error at build time when
the arguments of the mainline TRACE_EVENT() definitions do not match
the ones of the LTTng-modules adaptation layer
(LTTNG_TRACEPOINT_EVENT()).
Edit probes/Makefile and add your new kernel module object
next to existing ones:
# ...

obj-m += lttng-probe-module.o
obj-m += lttng-probe-power.o

obj-m += lttng-probe-hello.o

# ...
Time to build! Point to your custom Linux kernel source tree using
the KERNELDIR variable:
make KERNELDIR=/path/to/custom/linux
Finally, install modules:
sudo make modules_install
Tracing
The Controlling tracing section explains
how to use the lttng tool to create and control tracing sessions.
Although the lttng tool loads the appropriate known LTTng kernel
modules when needed (by launching root's session daemon), it won’t
load your custom lttng-probe-hello module by default. You need to
manually start an LTTng session daemon as root and use the
--extra-kmod-probes option to append your custom probe module to the
default list:
sudo pkill -u root lttng-sessiond
sudo lttng-sessiond --extra-kmod-probes=hello
The first command makes sure any existing instance is killed. If
you’re not interested in using the default probes, or if you only
want to use a few of them, you could use --kmod-probes instead,
which specifies an absolute list:
sudo lttng-sessiond --kmod-probes=hello,ext4,net,block,signal,sched
Confirm the custom probe module is loaded:
lsmod | grep lttng_probe_hello
The hello_world event should appear in the list when doing
lttng list --kernel | grep hello
You may now create an LTTng tracing session, enable the hello_world
kernel event (and others if you wish) and start tracing:
sudo lttng create my-session
sudo lttng enable-event --kernel hello_world
sudo lttng start
Plug a few USB devices, then stop tracing and inspect the trace (if Babeltrace is installed):
sudo lttng stop
sudo lttng view
Here’s a sample output:
[15:30:34.835895035] (+?.?????????) hostname hello_world: { cpu_id = 1 }, { my_int = 8, char0 = 68, char1 = 97, product = "DataTraveler 2.0" }
[15:30:42.262781421] (+7.426886386) hostname hello_world: { cpu_id = 1 }, { my_int = 9, char0 = 80, char1 = 97, product = "Patriot Memory" }
[15:30:48.175621778] (+5.912840357) hostname hello_world: { cpu_id = 1 }, { my_int = 10, char0 = 68, char1 = 97, product = "DataTraveler 2.0" }
Two USB flash drives were used for this test.
You may change your LTTng custom probe, rebuild it and reload it at
any time when not tracing. Make sure you remove the old module
(either by killing the root LTTng session daemon which loaded the
module in the first place, or by using modprobe --remove directly)
before loading the updated one.
Advanced: Instrumenting an out-of-tree Linux kernel module for LTTng
Instrumenting a custom Linux kernel module for LTTng follows the exact same steps as adding instrumentation to the Linux kernel itself, the only difference being that your mainline tracepoint definition header doesn’t reside in the mainline source tree, but in your kernel module source tree.
The only reference to this mainline header is in the LTTng custom
probe’s source code (probes/lttng-probe-hello.c in our example),
for build time verification:
/* ... */

/* Build time verification of mismatch between mainline TRACE_EVENT()
 * arguments and LTTng adaptation layer LTTNG_TRACEPOINT_EVENT() arguments.
 */
#include <trace/events/hello.h>

/* ... */
The preferred, flexible way to include your module’s mainline
tracepoint definition header is to put it in a specific directory
relative to your module’s root (tracepoints, for example) and include it
relative to your module’s root directory in the LTTng custom probe’s
source:
#include <tracepoints/hello.h>
You may then build LTTng-modules by adding your module’s root directory as an include path to the extra C flags:
make ccflags-y=-I/path/to/kernel/module KERNELDIR=/path/to/custom/linux
Using ccflags-y allows you to move your kernel module to another
directory and rebuild the LTTng-modules project with no change to
source files.
LTTng logger ABI
The lttng-tracer Linux kernel module, installed by the LTTng-modules
package, creates a special LTTng logger ABI file /proc/lttng-logger
when loaded. Writing text data to this file generates an LTTng kernel
domain event named lttng_logger.
Unlike other kernel domain events, lttng_logger may be enabled by
any user, not only root users or members of the tracing group.
To use the LTTng logger ABI, simply write a string to
/proc/lttng-logger:
echo -n 'Hello, World!' > /proc/lttng-logger
The msg field of the lttng_logger event contains the recorded
message.
Note:Messages are split in chunks of 1024 bytes.
The LTTng logger ABI is a quick and easy way to trace some events from user space through the kernel tracer. However, it is much more basic than LTTng-UST: it’s slower (involves system call round-trip to the kernel and only supports logging strings). The LTTng logger ABI is particularly useful for recording logs as LTTng traces from shell scripts, potentially combining them with other Linux kernel/user space events.
Advanced: Instrumenting a 32-bit application on a 64-bit system
In order to trace a 32-bit application running on a 64-bit system, LTTng must use a dedicated 32-bit consumer daemon. This section discusses how to build that daemon (which is not part of the default 64-bit LTTng build) and the LTTng 32-bit tracing libraries, and how to instrument a 32-bit application in that context.
Make sure you install all 32-bit versions of LTTng dependencies.
Their names can be found in the README.md files of each LTTng package
source. How to find and install them depends on your target’s
Linux distribution. gcc-multilib is a common package name for the
multilib version of GCC, which you also need.
The following packages will be built for 32-bit support on a 64-bit system: Userspace RCU, LTTng-UST and LTTng-tools.
Building 32-bit Userspace RCU
Follow this:
git clone git://git.urcu.so/urcu.git
cd urcu
./bootstrap
./configure --libdir=/usr/lib32 CFLAGS=-m32
make
sudo make install
sudo ldconfig
The -m32 C compiler flag creates 32-bit object files and --libdir
indicates where to install the resulting libraries.
Building 32-bit LTTng-UST
Follow this:
git clone http://git.lttng.org/lttng-ust.git
cd lttng-ust
./bootstrap
./configure --prefix=/usr \
          --libdir=/usr/lib32 \
          CFLAGS=-m32 CXXFLAGS=-m32 \
          LDFLAGS=-L/usr/lib32
make
sudo make install
sudo ldconfig
-L/usr/lib32 is required for the build to find the 32-bit versions
of Userspace RCU and other dependencies.
Note:Depending on your Linux distribution,
32-bit libraries could be installed at a different location than
/usr/lib32. For example, Debian is known to install
some 32-bit libraries in /usr/lib/i386-linux-gnu.
In this case, make sure to set LDFLAGS to all the
relevant 32-bit library paths, for example,
LDFLAGS="-L/usr/lib32 -L/usr/lib/i386-linux-gnu".
Note:You may add options to ./configure if you need them, e.g., for
Java and SystemTap support. Look at ./configure --help for more
information.
Building 32-bit LTTng-tools
Since the host is a 64-bit system, most 32-bit binaries and libraries of LTTng-tools are not needed; the host uses their 64-bit counterparts. The required step here is building and installing a 32-bit consumer daemon.
Follow this:
git clone http://git.lttng.org/lttng-tools.git
cd lttng-ust
./bootstrap
./configure --prefix=/usr \
          --libdir=/usr/lib32 CFLAGS=-m32 CXXFLAGS=-m32 \
          LDFLAGS=-L/usr/lib32
make
cd src/bin/lttng-consumerd
sudo make install
sudo ldconfig
The above commands build all the LTTng-tools project as 32-bit applications, but only installs the 32-bit consumer daemon.
Building 64-bit LTTng-tools
Finally, you need to build a 64-bit version of LTTng-tools which is aware of the 32-bit consumer daemon previously built and installed:
make clean
./bootstrap
./configure --prefix=/usr \
          --with-consumerd32-libdir=/usr/lib32 \
          --with-consumerd32-bin=/usr/lib32/lttng/libexec/lttng-consumerd
make
sudo make install
sudo ldconfig
Henceforth, the 64-bit session daemon automatically finds the 32-bit consumer daemon if required.
Building an instrumented 32-bit C application
Let us reuse the Hello world example of Tracing your own user application (Getting started chapter).
The instrumentation process is unaltered.
First, a typical 64-bit build (assuming you’re running a 64-bit system):
gcc -o hello64 -I. hello.c hello-tp.c -ldl -llttng-ust
Now, a 32-bit build:
gcc -o hello32 -I. -m32 hello.c hello-tp.c -L/usr/lib32 \
  -ldl -llttng-ust -Wl,-rpath,/usr/lib32
The -rpath option, passed to the linker, makes the dynamic loader
check for libraries in /usr/lib32 before looking in its default paths,
where it should find the 32-bit version of liblttng-ust.
Running 32-bit and 64-bit versions of an instrumented C application
Now, both 32-bit and 64-bit versions of the Hello world example above
can be traced in the same tracing session. Use the lttng tool as usual
to create a tracing session and start tracing:
lttng create session-3264
lttng enable-event -u -a
./hello32
./hello64
lttng stop
Use lttng view to verify both processes were
successfully traced.
Controlling tracing
Once you’re in possession of a software that is properly
instrumented for LTTng tracing, be it thanks to
the built-in LTTng probes for the Linux kernel, a custom user
application or a custom Linux kernel, all that is left is actually
tracing it. As a user, you control LTTng tracing using a single command
line interface: the lttng tool. This tool uses liblttng-ctl behind
the scene to connect to and communicate with session daemons. LTTng
session daemons may either be started manually (lttng-sessiond) or
automatically by the lttng command when needed. Trace data may
be forwarded to the network and used elsewhere using an LTTng relay
daemon (lttng-relayd).
The manpages of lttng, lttng-sessiond and lttng-relayd are pretty
complete, thus this section is not an online copy of the latter (we
leave this contents for the
Online LTTng manpages section).
This section is rather a tour of LTTng
features through practical examples and tips.
If not already done, make sure you understand the core concepts and how LTTng components connect together by reading the Understanding LTTng chapter; this section assumes you are familiar with them.
Creating and destroying tracing sessions
Whatever you want to do with lttng, it has to happen inside a
tracing session, created beforehand. A session, in general, is a
per-user container of state. A tracing session is no different; it
keeps a specific state of stuff like:
-
session name
-
enabled/disabled channels with associated parameters
-
enabled/disabled events with associated log levels and filters
-
context information added to channels
-
tracing activity (started or stopped)
and more.
A single user may have many active tracing sessions. LTTng session
daemons are the ultimate owners and managers of tracing sessions. For
user space tracing, each user has its own session daemon. Since Linux
kernel tracing requires root privileges, only root's session daemon
may enable and trace kernel events. However, lttng has a --group
option (which is passed to lttng-sessiond when starting it) to
specify the name of a tracing group which selected users may be part
of to be allowed to communicate with root's session daemon. By
default, the tracing group name is tracing.
To create a tracing session, do:
lttng create my-session
This creates a new tracing session named my-session and make it
the current one. If you don’t specify a name (running only
lttng create), your tracing session is named auto followed by the
current date and time. Traces
are written in \~/lttng-traces/session- followed
by the tracing session’s creation date/time by default, where
session is the tracing session name. To save them
at a different location, use the --output option:
lttng create --output /tmp/some-directory my-session
You may create as many tracing sessions as you wish:
lttng create other-session
lttng create yet-another-session
You may view all existing tracing sessions using the list command:
lttng list
The state of a current tracing session is kept in ~/.lttngrc. Each
invocation of lttng reads this file to set its current tracing
session name so that you don’t have to specify a session name for each
command. You could edit this file manually, but the preferred way to
set the current tracing session is to use the set-session command:
lttng set-session other-session
Most lttng commands accept a --session option to specify the name
of the target tracing session.
Any existing tracing session may be destroyed using the destroy
command:
lttng destroy my-session
Providing no argument to lttng destroy destroys the current
tracing session. Destroying a tracing session stops any tracing
running within the latter. Destroying a tracing session frees resources
acquired by the session daemon and tracer side, making sure to flush
all trace data.
You can’t do much with LTTng using only the create, set-session
and destroy commands of lttng, but it is essential to know them in
order to control LTTng tracing, which always happen within the scope of
a tracing session.
Enabling and disabling events
Inside a tracing session, individual events may be enabled or disabled so that tracing them may or may not generate trace data.
We sometimes use the term event metonymically throughout this text to refer to a specific condition, or rule, that could lead, when satisfied, to an actual occurring event (a point at a specific position in source code/binary program, logical processor and time capturing some payload) being recorded as trace data. This specific condition is composed of:
-
A domain (kernel, user space,
java.util.logging, or log4j) (required). -
One or many instrumentation points in source code or binary program (tracepoint name, address, symbol name, function name, logger name, amongst other types of probes) to be executed (required).
-
A log level (each instrumentation point declares its own log level) or log level range to match (optional; only valid for user space domain).
-
A custom user expression, or filter, that must evaluate to true when a tracepoint is executed (optional; only valid for user space domain).
All conditions are specified using arguments passed to the
enable-event command of the lttng tool.
Condition 1 is specified using either --kernel/-k (kernel),
--userspace/-u (user space), --jul/-j
(JUL), or --log4j/-l (log4j).
Exactly one of those four arguments must be specified.
Condition 2 is specified using one of:
-
--tracepoint -
Tracepoint.
-
--probe -
Dynamic probe (address, symbol name or combination of both in binary program; only valid for kernel domain).
-
--function -
function entry/exit (address, symbol name or combination of both in binary program; only valid for kernel domain).
-
--syscall -
System call entry/exit (only valid for kernel domain).
When none of the above is specified, enable-event defaults to
using --tracepoint.
Condition 3 is specified using one of:
-
--loglevel -
Log level range from the specified level to the most severe level.
-
--loglevel-only -
Specific log level.
See lttng enable-event --help for the complete list of log level
names.
Condition 4 is specified using the --filter option. This filter is
a C-like expression, potentially reading real-time values of event
fields, that has to evaluate to true for the condition to be satisfied.
Event fields are read using plain identifiers while context fields
must be prefixed with $ctx.. See lttng enable-event --help for
all usage details.
The aforementioned arguments are combined to create and enable events. Each unique combination of arguments leads to a different enabled event. The log level and filter arguments are optional, their default values being respectively all log levels and a filter which always returns true.
Here are a few examples (you must create a tracing session first):
lttng enable-event -u --tracepoint my_app:hello_world
lttng enable-event -u --tracepoint my_app:hello_you --loglevel TRACE_WARNING
lttng enable-event -u --tracepoint 'my_other_app:*'
lttng enable-event -u --tracepoint my_app:foo_bar \
                 --filter 'some_field <= 23 && !other_field'
lttng enable-event -k --tracepoint sched_switch
lttng enable-event -k --tracepoint gpio_value
lttng enable-event -k --function usb_probe_device usb_probe_device
lttng enable-event -k --syscall --all
The wildcard symbol, *, matches anything and may only be used at
the end of the string when specifying a tracepoint. Make sure to
use it between single quotes in your favorite shell to avoid
undesired shell expansion.
System call events can be enabled individually, too:
lttng enable-event -k --syscall open
lttng enable-event -k --syscall read
lttng enable-event -k --syscall fork,chdir,pipe
The complete list of available system call events can be obtained using
lttng list --kernel --syscall
You can see a list of events (enabled or disabled) using
lttng list some-session
where some-session is the name of the desired tracing session.
What you’re actually doing when enabling events with specific conditions is creating a whitelist of traceable events for a given channel. Thus, the following case presents redundancy:
lttng enable-event -u --tracepoint my_app:hello_you
lttng enable-event -u --tracepoint my_app:hello_you --loglevel TRACE_DEBUG
The second command, matching a log level range, is useless since the first
command enables all tracepoints matching the same name,
my_app:hello_you.
Disabling an event is simpler: you only need to provide the event
name to the disable-event command:
lttng disable-event --userspace my_app:hello_you
This name has to match a name previously given to enable-event (it
has to be listed in the output of lttng list some-session).
The * wildcard is supported, as long as you also used it in a
previous enable-event invocation.
Disabling an event does not add it to some blacklist: it simply removes it from its channel’s whitelist. This is why you cannot disable an event which wasn’t previously enabled.
A disabled event doesn’t generate any trace data, even if all its specified conditions are met.
Events may be enabled and disabled at will, either when LTTng tracers are active or not. Events may be enabled before a user space application is even started.
Basic tracing session control
Once you have created a tracing session and enabled one or more events, you may activate the LTTng tracers for the current tracing session at any time:
lttng start
Subsequently, you may stop the tracers:
lttng stop
LTTng is very flexible: user space applications may be launched before or after the tracers are started. Events are only recorded if they are properly enabled and if they occur while tracers are active.
A tracing session name may be passed to both the start and stop
commands to start/stop tracing a session other than the current one.
Enabling and disabling channels
As mentioned in the Understanding LTTng chapter, enabled events are contained in a specific channel, itself contained in a specific tracing session. A channel is a group of events with tunable parameters (event loss mode, sub-buffer size, number of sub-buffers, trace file sizes and count, to name a few). A given channel may only be responsible for enabled events belonging to one domain: either kernel or user space.
If you only used the create, enable-event and start/stop
commands of the lttng tool so far, one or two channels were
automatically created for you (one for the kernel domain and/or one
for the user space domain). The default channels are both named
channel0; channels from different domains may have the same name.
The current channels of a given tracing session can be viewed with
lttng list some-session
where some-session is the name of the desired tracing session.
To create and enable a channel, use the enable-channel command:
lttng enable-channel --kernel my-channel
This creates a kernel domain channel named my-channel with
default parameters in the current tracing session.
Note:Because of a current limitation, all
channels must be created prior to beginning tracing in a
given tracing session, that is before the first time you do
lttng start.
Since a channel is automatically created by
enable-event only for the specified domain, you cannot,
for example, enable a kernel domain event, start tracing and then
enable a user space domain event because no user space channel
exists yet and it’s too late to create one.
For this reason, make sure to configure your channels properly before starting the tracers for the first time!
Here’s another example:
lttng enable-channel --userspace --session other-session --overwrite \
                   --tracefile-size 1048576 1mib-channel
This creates a user space domain channel named 1mib-channel in
the tracing session named other-session that loses new events by
overwriting previously recorded events (instead of the default mode of
discarding newer ones) and saves trace files with a maximum size of
1 MiB each.
Note that channels may also be created using the --channel option of
the enable-event command when the provided channel name doesn’t exist
for the specified domain:
lttng enable-event --kernel --channel some-channel sched_switch
If no kernel domain channel named some-channel existed before calling
the above command, it would be created with default parameters.
You may enable the same event in two different channels:
lttng enable-event --userspace --channel my-channel app:tp
lttng enable-event --userspace --channel other-channel app:tp
If both channels are enabled, the occurring app:tp event
generates two recorded events, one for each channel.
Disabling a channel is done with the disable-event command:
lttng disable-event --kernel some-channel
The state of a channel precedes the individual states of events within it: events belonging to a disabled channel, even if they are enabled, won’t be recorded.
Fine-tuning channels
There are various parameters that may be fine-tuned with the
enable-channel command. The latter are well documented in
lttng(1) and in the Channel section of the
Understanding LTTng chapter. For basic
tracing needs, their default values should be just fine, but here are a
few examples to break the ice.
As the frequency of recorded events increases—either because the
event throughput is actually higher or because you enabled more events
than usual—event loss might be experienced. Since LTTng never
waits, by design, for sub-buffer space availability (non-blocking
tracer), when a sub-buffer is full and no empty sub-buffers are left,
there are two possible outcomes: either the new events that do not fit
are rejected, or they start replacing the oldest recorded events.
The choice of which algorithm to use is a per-channel parameter, the
default being discarding the newest events until there is some space
left. If your situation always needs the latest events at the expense
of writing over the oldest ones, create a channel with the --overwrite
option:
lttng enable-channel --kernel --overwrite my-channel
When an event is lost, it means no space was available in any sub-buffer to accommodate it. Thus, if you want to cope with sporadic high event throughput situations and avoid losing events, you need to allocate more room for storing them in memory. This can be done by either increasing the size of sub-buffers or by adding sub-buffers. The following example creates a user space domain channel with 16 sub-buffers of 512 kiB each:
lttng enable-channel --userspace --num-subbuf 16 --subbuf-size 512k big-channel
Both values need to be powers of two, otherwise they are rounded up to the next one.
Two other interesting available parameters of enable-channel are
--tracefile-size and --tracefile-count, which respectively limit
the size of each trace file and the their count for a given channel.
When the number of written trace files reaches its limit for a given
channel-CPU pair, the next trace file overwrites the very first
one. The following example creates a kernel domain channel with a
maximum of three trace files of 1 MiB each:
lttng enable-channel --kernel --tracefile-size 1M --tracefile-count 3 my-channel
An efficient way to make sure lots of events are generated is enabling all kernel events in this channel and starting the tracer:
lttng enable-event --kernel --all --channel my-channel
lttng start
After a few seconds, look at trace files in your tracing session output directory. For two CPUs, it should look like:
my-channel_0_0    my-channel_1_0
my-channel_0_1    my-channel_1_1
my-channel_0_2    my-channel_1_2
Amongst the files above, you might see one in each group with a size lower than 1 MiB: they are the files currently being written.
Since all those small files are valid LTTng trace files, LTTng trace viewers may read them. It is the viewer’s responsibility to properly merge the streams so as to present an ordered list to the user. Babeltrace merges LTTng trace files correctly and is fast at doing it.
Adding some context to channels
If you read all the sections of
Controlling tracing so far, you should be
able to create tracing sessions, create and enable channels and events
within them and start/stop the LTTng tracers. Event fields recorded in
trace files provide important information about occurring events, but
sometimes external context may help you solve a problem faster. This
section discusses how to add context information to events of a
specific channel using the lttng tool.
There are various available context values which can accompany events recorded by LTTng, for example:
-
process information:
-
identifier (PID)
-
name
-
priority
-
scheduling priority (niceness)
-
thread identifier (TID)
-
-
the hostname of the system on which the event occurred
-
plenty of performance counters using perf, for example:
-
CPU cycles, stalled cycles, idle cycles, and the other cycle types
-
cache misses
-
branch instructions, misses, loads
-
CPU faults
-
The full list is available in the output of lttng add-context --help.
Some of them are reserved for a specific domain (kernel or
user space) while others are available for both.
To add context information to one or all channels of a given tracing
session, use the add-context command:
lttng add-context --userspace --type vpid --type perf:thread:cpu-cycles
The above example adds the virtual process identifier and per-thread
CPU cycles count values to all recorded user space domain events of the
current tracing session. Use the --channel option to select a specific
channel:
lttng add-context --kernel --channel my-channel --type tid
adds the thread identifier value to all recorded kernel domain events
in the channel my-channel of the current tracing session.
Beware that context information cannot be removed from channels once it’s added for a given tracing session.
Saving and loading tracing session configurations
Configuring a tracing session may be long: creating and enabling
channels with specific parameters, enabling kernel and user space
domain events with specific log levels and filters, and adding context
to some channels are just a few of the many possible operations using
the lttng command line tool. If you’re going to use LTTng to solve real
world problems, chances are you’re going to have to record events using
the same tracing session setup over and over, modifying a few variables
each time in your instrumented program or environment. To avoid
constant tracing session reconfiguration, the lttng tool is able to
save and load tracing session configurations to/from XML files.
To save a given tracing session configuration, do:
lttng save my-session
where my-session is the name of the tracing session to save. Tracing
session configurations are saved to ~/.lttng/sessions by default;
use the --output-path option to change this destination directory.
All configuration parameters are saved:
-
tracing session name
-
trace data output path
-
channels with their state and all their parameters
-
context information added to channels
-
events with their state, log level and filter
-
tracing activity (started or stopped)
To load a tracing session, simply do:
lttng load my-session
or, if you used a custom path:
lttng load --input-path /path/to/my-session.lttng
Your saved tracing session is restored as if you just configured it manually.
Sending trace data over the network
The possibility of sending trace data over the network comes as a built-in feature of LTTng-tools. For this to be possible, an LTTng relay daemon must be executed and listening on the machine where trace data is to be received, and the user must create a tracing session using appropriate options to forward trace data to the remote relay daemon.
The relay daemon listens on two different TCP ports: one for control information and the other for actual trace data.
Starting the relay daemon on the remote machine is easy:
lttng-relayd
This makes it listen to its default ports: 5342 for control and
5343 for trace data. The --control-port and --data-port options may
be used to specify different ports.
Traces written by lttng-relayd are written to
~/lttng-traces/hostname/session by
default, where hostname is the host name of the
traced (monitored) system and session is the
tracing session name. Use the --output option to write trace data
outside ~/lttng-traces.
On the sending side, a tracing session must be created using the
lttng tool with the --set-url option to connect to the distant
relay daemon:
lttng create my-session --set-url net://distant-host
The URL format is described in the output of lttng create --help.
The above example uses the default ports; the --ctrl-url and
--data-url options may be used to set the control and data URLs
individually.
Once this basic setup is completed and the connection is established,
you may use the lttng tool on the target machine as usual; everything
you do is transparently forwarded to the remote machine if needed.
For example, a parameter changing the maximum size of trace files
only has an effect on the distant relay daemon actually writing
the trace.
Viewing events as they arrive
We have seen how trace files may be produced by LTTng out of generated application and Linux kernel events. We have seen that those trace files may be either recorded locally by consumer daemons or remotely using a relay daemon. And we have seen that the maximum size and count of trace files is configurable for each channel. With all those features, it’s still not possible to read a trace file as it is being written because it could be incomplete and appear corrupted to the viewer. There is a way to view events as they arrive, however: using LTTng live.
LTTng live is implemented, in LTTng, solely on the relay daemon side. As trace data is sent over the network to a relay daemon by a (possibly remote) consumer daemon, a tee is created: trace data is recorded to trace files as well as being transmitted to a connected live viewer:
In order to use this feature, a tracing session must created in live mode on the target system:
lttng create --live
An optional parameter may be passed to --live to set the period
(in microseconds) between flushes to the network
(1 second is the default). With:
lttng create --live 100000
the daemons flush their data every 100 ms.
If no network output is specified to the create command, a local
relay daemon is spawned. In this very common case, viewing a live
trace is easy: enable events and start tracing as usual, then use
lttng view to start the default live viewer:
lttng view
The correct arguments are passed to the live viewer so that it may connect to the local relay daemon and start reading live events.
You may also wish to use a live viewer not running on the target
system. In this case, you should specify a network output when using
the create command (--set-url or --ctrl-url/--data-url options).
A distant LTTng relay daemon should also be started to receive control
and trace data. By default, lttng-relayd listens on 127.0.0.1:5344
for an LTTng live connection. Otherwise, the desired URL may be
specified using its --live-port option.
The
babeltrace
viewer supports LTTng live as one of its input formats. babeltrace is
the default viewer when using lttng view. To use it manually, first
list active tracing sessions by doing the following (assuming the relay
daemon to connect to runs on the same host):
babeltrace --input-format lttng-live net://localhost
Then, choose a tracing session and start viewing events as they arrive using LTTng live:
babeltrace --input-format lttng-live net://localhost/host/hostname/my-session
Taking a snapshot
The normal behavior of LTTng is to record trace data as trace files. This is ideal for keeping a long history of events that occurred on the target system and applications, but may be too much data in some situations. For example, you may wish to trace your application continuously until some critical situation happens, in which case you would only need the latest few recorded events to perform the desired analysis, not multi-gigabyte trace files.
LTTng has an interesting feature called snapshots. When creating a tracing session in snapshot mode, no trace files are written; the tracers' sub-buffers are constantly overwriting the oldest recorded events with the newest. At any time, either when the tracers are started or stopped, you may take a snapshot of those sub-buffers.
There is no difference between the format of a normal trace file and the format of a snapshot: viewers of LTTng traces also support LTTng snapshots. By default, snapshots are written to disk, but they may also be sent over the network.
To create a tracing session in snapshot mode, do:
lttng create --snapshot my-snapshot-session
Next, enable channels, events and add context to channels as usual.
Once a tracing session is created in snapshot mode, channels are
forced to use the
overwrite mode
(--overwrite option of the enable-channel command; also called
flight recorder mode) and have an mmap() channel type
(--output mmap).
Start tracing. When you’re ready to take a snapshot, do:
lttng snapshot record --name my-snapshot
This records a snapshot named my-snapshot of all channels of
all domains of the current tracing session. By default, snapshots files
are recorded in the path returned by lttng snapshot list-output. You
may change this path or decide to send snapshots over the network
using either:
-
an output path/URL specified when creating the tracing session (
lttng create) -
an added snapshot output path/URL using
lttng snapshot add-output -
an output path/URL provided directly to the
lttng snapshot recordcommand
Method 3 overrides method 2 which overrides method 1. When specifying a URL, a relay daemon must be listening on some machine (see Sending trace data over the network).
If you need to make absolutely sure that the output file won’t be
larger than a certain limit, you can set a maximum snapshot size when
taking it with the --max-size option:
lttng snapshot record --name my-snapshot --max-size 2M
Older recorded events are discarded in order to respect this maximum size.
Machine interface
The lttng tool aims at providing a command output as human-readable as
possible. While this output is easy to parse by a human being, machines
have a hard time.
This is why the lttng tool provides the general --mi option, which
must specify a machine interface output format. As of the latest
LTTng stable release, only the xml format is supported. A schema
definition (XSD) is made
available
to ease the integration with external tools as much as possible.
The --mi option can be used in conjunction with all lttng commands.
Here are some examples:
lttng --mi xml create some-session
lttng --mi xml list some-session
lttng --mi xml list --kernel
lttng --mi xml enable-event --kernel --syscall open
lttng --mi xml start
Reference
This chapter presents various references for LTTng packages such as links to online manpages, tables needed by the rest of the text, descriptions of library functions, and more.
Online LTTng manpages
LTTng packages currently install the following man pages, available online using the links below:
-
LTTng-tools
-
LTTng-UST
LTTng-UST
This section presents references of the LTTng-UST package.
LTTng-UST library (liblttng‑ust)
The LTTng-UST library, or liblttng-ust, is the main shared object
against which user applications are linked to make LTTng user space
tracing possible.
The C application guide shows the complete process to instrument, build and run a C/C++ application using LTTng-UST, while this section contains a few important tables.
Tracepoint fields macros (for TP_FIELDS())
The available macros to define tracepoint fields, which should be listed
within TP_FIELDS() in TRACEPOINT_EVENT(), are:
Available macros to define LTTng-UST tracepoint fields
| Macro | Description and parameters |
|---|---|
| Standard integer, displayed in base 10.
|
| Standard integer, displayed in base 16.
|
| Integer in network byte order (big endian), displayed in base 10.
|
| Integer in network byte order, displayed in base 16.
|
| Floating point number.
|
| Null-terminated string; undefined behavior if
|
| Statically-sized array of integers
|
| Statically-sized array, printed as text. The string does not need to be null-terminated.
|
| Dynamically-sized array of integers. The type of
|
| Dynamically-sized array, displayed as text. The string does not need to be null-terminated. The type of The behaviour is undefined if
|
The _nowrite versions omit themselves from the session trace, but are
otherwise identical. This means the _nowrite fields won’t be written
in the recorded trace. Their primary purpose is to make some
of the event context available to the
event filters without having to
commit the data to sub-buffers.
Tracepoint log levels (for TRACEPOINT_LOGLEVEL())
The following table shows the available log level values for the
TRACEPOINT_LOGLEVEL() macro:
-
TRACE_EMERG -
System is unusable.
-
TRACE_ALERT -
Action must be taken immediately.
-
TRACE_CRIT -
Critical conditions.
-
TRACE_ERR -
Error conditions.
-
TRACE_WARNING -
Warning conditions.
-
TRACE_NOTICE -
Normal, but significant, condition.
-
TRACE_INFO -
Informational message.
-
TRACE_DEBUG_SYSTEM -
Debug information with system-level scope (set of programs).
-
TRACE_DEBUG_PROGRAM -
Debug information with program-level scope (set of processes).
-
TRACE_DEBUG_PROCESS -
Debug information with process-level scope (set of modules).
-
TRACE_DEBUG_MODULE -
Debug information with module (executable/library) scope (set of units).
-
TRACE_DEBUG_UNIT -
Debug information with compilation unit scope (set of functions).
-
TRACE_DEBUG_FUNCTION -
Debug information with function-level scope.
-
TRACE_DEBUG_LINE -
Debug information with line-level scope (TRACEPOINT_EVENT default).
-
TRACE_DEBUG -
Debug-level message.
Log levels TRACE_EMERG through TRACE_INFO and TRACE_DEBUG match
syslog
level semantics. Log levels TRACE_DEBUG_SYSTEM through TRACE_DEBUG
offer more fine-grained selection of debug information.
LTTng-modules
This section presents references of the LTTng-modules package.
Tracepoint fields macros (for TP_STRUCT__entry())
This table describes possible entries for the TP_STRUCT__entry() part
of LTTNG_TRACEPOINT_EVENT():
Available entries for TP_STRUCT__entry() (in LTTNG_TRACEPOINT_EVENT())
| Macro | Description and parameters |
|---|---|
| Standard integer, displayed in base 10.
|
| Standard integer, displayed in base 16.
|
| Standard integer, displayed in base 8.
|
| Integer in network byte order (big endian), displayed in base 10.
|
| Integer in network byte order (big endian), displayed in base 16.
|
| Statically-sized array, elements displayed in base 10.
|
| Statically-sized array, elements displayed in base 16.
|
| Statically-sized array, displayed as text.
|
| Dynamically-sized array, displayed in base 10.
|
| Dynamically-sized array, displayed in base 16.
|
| Dynamically-sized array, displayed as text.
|
| Null-terminated string. The behaviour is undefined behavior if
|
The above macros should cover the majority of cases. For advanced items,
see probes/lttng-events.h.
Tracepoint assignment macros (for TP_fast_assign())
This table describes possible entries for the TP_fast_assign() part
of LTTNG_TRACEPOINT_EVENT():
Available entries for TP_fast_assign() (in LTTNG_TRACEPOINT_EVENT())
| Macro | Description and parameters |
|---|---|
| Assignment of C expression
|
| Memory copy of
|
| Memory copy of
|
| Memory copy of dynamically-sized array from The number of bytes is known from the field’s length expression (use with dynamically-sized array fields).
|
| String copy of
|