The new dynamic user space tracing feature in LTTng

LTTng’s upcoming 2.11 release brings several exciting new features, including session rotation and user and kernel space call stack capture. This post takes a look at another new feature that's currently available in the 2.11 RC releases: dynamic user space tracing. This feature allows you to instrument functions in user space apps and shared libraries at run time by adding and removing user space probes.
Dynamic tracing is especially powerful for debugging live systems, since you don’t need to use special debug versions of apps or libraries or scatter printf() statements throughout your code. Instead, you can instrument functions “on the fly,” investigating issues as they arise — without affecting the system.
This article provides an overview of the two new tracing instrumentation options: instrumenting library functions and accessing DTrace-style SDT probes. But first, let’s dive into how dynamic tracing works.
ELF functions and SDT probes
User space dynamic tracing with LTTng works by hooking into predetermined locations in your code, and these locations can be either ELF functions or SDT probes.
An ELF file’s functions are listed in a symbol table in the file’s metadata. You don’t need to do anything special to make these functions available for tracing.
SDT probes, on the other hand, are individually inserted into apps and libraries by their authors and require additional toolchain support. SDT probes are shipped for a wide range of libraries and apps on many Linux distributions, and they’re implemented by inserting nop instructions wherever the STAP_PROBE* family of macros are used in source code. Using nop instructions as placeholders allows other executable instructions to be inserted when probes are attached but has almost no impact on performance when they’re disabled.
Whether you’re tracing ELF functions or SDT probes, the actual probe insertion and event recording is handled by the Linux kernel’s uprobe interface, and events are recorded in the kernel’s buffer. This means you need a session daemon running as root to load the required kernel modules and use this feature.
Instrumenting a library function
Below is an example that instruments libc's malloc() function, which
produces an event on every invocation of malloc() by any application
linked to libc.
Reminder: You need to use the kernel tracer (see how). Although you’re instrumenting user space code, what you’re actually tracing is a kernel event that uses the kernel’s uprobe facility.
Create a new session:
$
lttng create my-session
Attach the libc
malloc()function and enable the userspace probe.my_libc_malloc_probeis the name picked by the user. Note that the location of libc on your system might be different:$
 lttng enable-event --kernel \
                     --userspace-probe /lib/x86_64-linux-gnu/libc.so.6:malloc \
                     my_libc_malloc_probe
Start tracing:
$
lttng start
Create some trace events by executing an application:
$
/bin/ls
Stop tracing:
$
lttng stop
Display the events:
$
lttng view
[22:46:10.186961552] (+0.000006848) x1 my_libc_malloc_probe: { cpu_id = 3 }, { ip = 0x7FC155182130 }
[22:46:10.186966344] (+0.000004792) x1 my_libc_malloc_probe: { cpu_id = 3 }, { ip = 0x7FC155182130 }
[22:46:10.186970565] (+0.000004221) x1 my_libc_malloc_probe: { cpu_id = 3 }, { ip = 0x7FC155182130 }
Each line in the above output shows the timestamp of the event, the
hostname of the machine where the event occurred, the probe name, the
CPU the event occurred on, and finally, the address that called
malloc().
Attaching to an SDT probe
Unlike tracing library functions, SDT probes are explicitly inserted by
developers to help with debugging and tracing, which means they’re
strategically placed in the code at locations you’re likely to need to
attach to a probe. For example, the libc:memory_sbrk_more
probe is located in libc’s malloc() and records the
arguments to the sbrk() system call when more memory needs
to be allocated to service the request for memory.
Before you can attach to an SDT probe, you need to know which ones are
available in the library of application you’re using. You can discover the list
of probes by looking at the ELF notes section using readelf. For
example, here is part of the ELF notes section of the libc.so.6
library as showed by readelf.
$
readelf -n /lib/x86_64-linux-gnu/libc.so.6
[...]
Displaying notes found in: .note.stapsdt
  Owner                 Data size	Description
  stapsdt              0x0000003a	NT_STAPSDT (SystemTap probe descriptors)
    Provider: libc
    Name: setjmp
    Location: 0x000000000003ebb1, Base: 0x00000000001bdd48, Semaphore: 0x0000000000000000
    Arguments: 8@%rdi -4@%esi 8@%rax

[...]
The note sections you’re interested in are the ones own by stapsdt
with the NT_STAPSDT description. These notes sections show all
probes in the library or app, as well as the most important parts of each
entry, Provider and Name — you’ll need these two when
attaching to a probe.
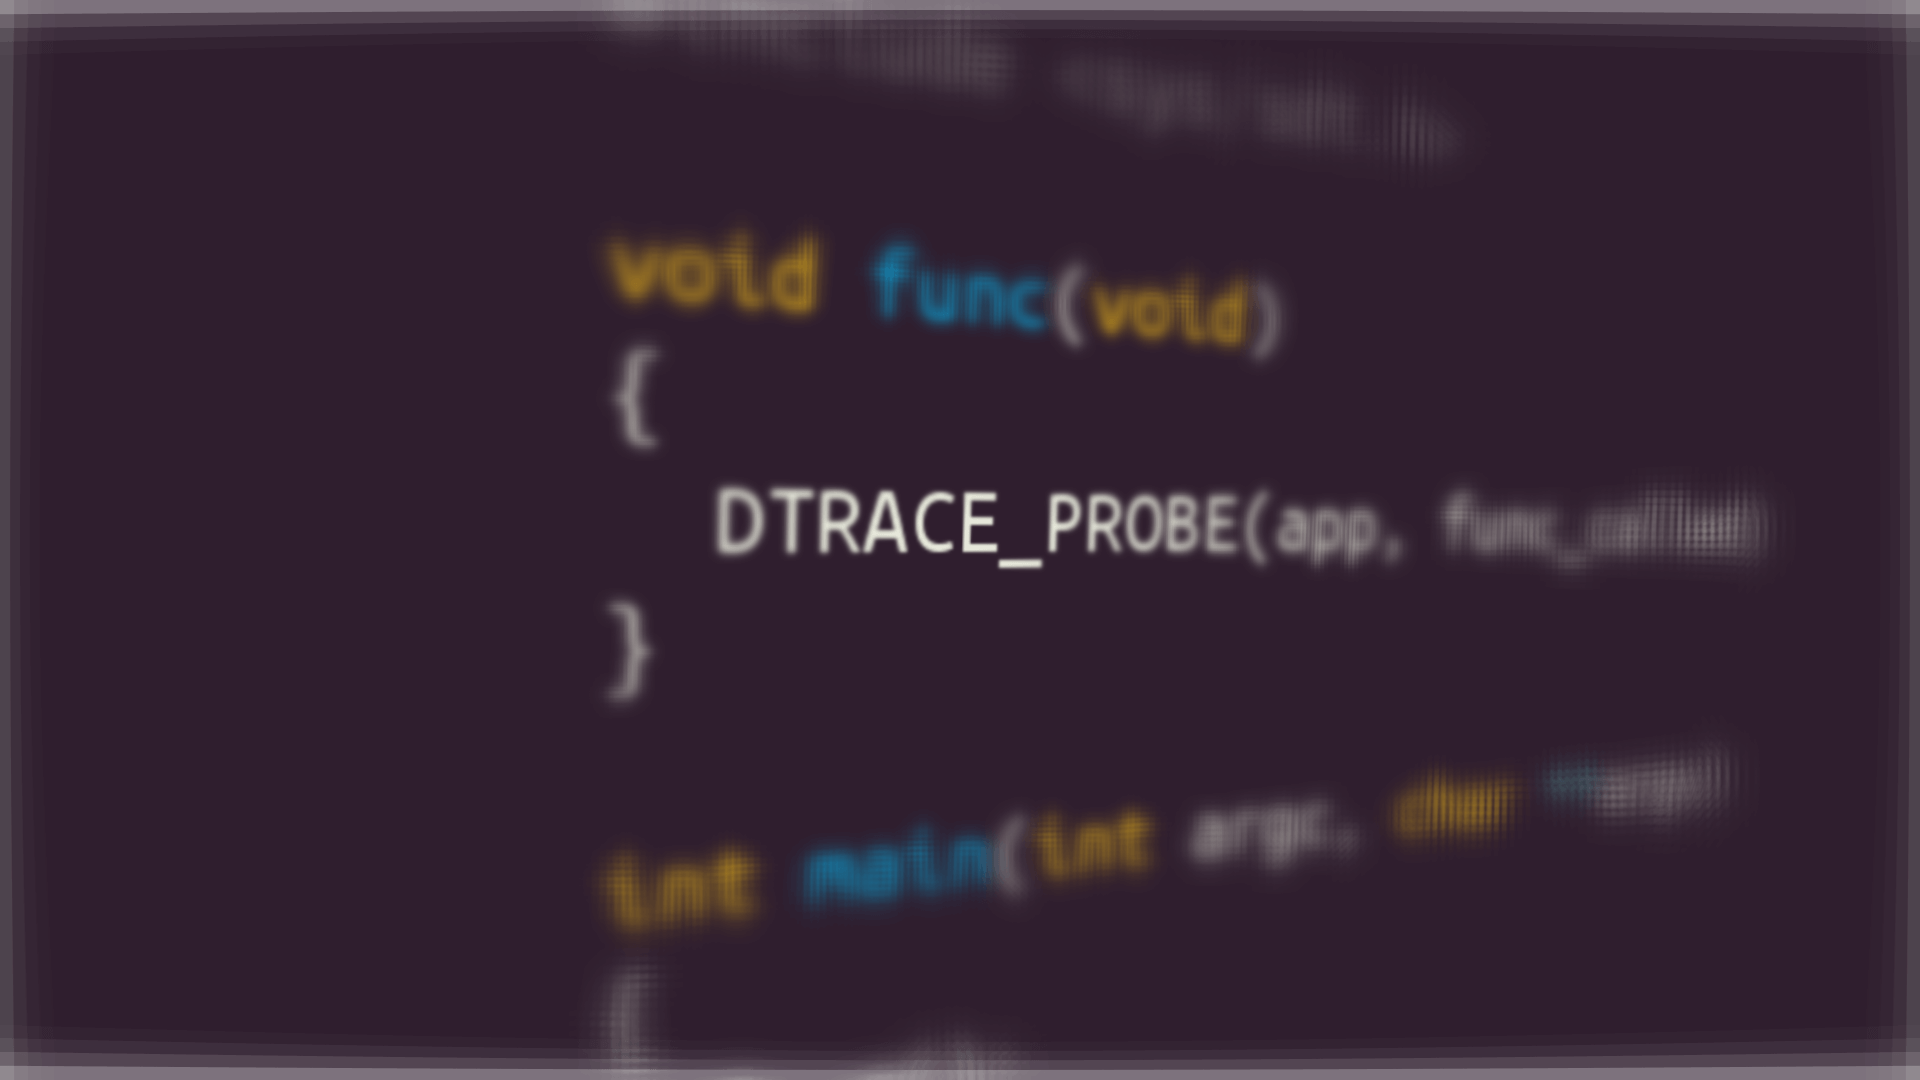
Adding a probe to your own code is easy, and the following code snippet includes everything you need to create a working example:
#include <sys/sdt.h>

void func(void)
{
	DTRACE_PROBE(my_provider, my_probe);
}

int main(int argc, char **argv)
{
	func();
	return 0;
}
To attach to the my_provider:my_probe probe in the above example,
use the following commands:
Gather SDT probe information:
$
readelf -n /path/to/executable
[...]
Displaying notes found in: .note.stapsdt
  Owner                 Data size	Description
  stapsdt              0x0000002e	NT_STAPSDT (SystemTap probe descriptors)
    Provider: my_provider
    Name: my_probe
[...]
Create a new session:
$
lttng create sdt-probe-session
Attach to the
my_provider:my_probeprobe:$
 lttng enable-event --kernel \
                    --userspace-probe=sdt:/path/to/executable:my_provider:my_probe \
                    my_probe_called
Start tracing:
$
lttng start
Create an event by executing the app once:
$
/path/to/executable
Stop tracing:
$
lttng stop
And finally, display the event:
$
lttng view
Trace directory: /home/user/lttng-traces/sdt-probe-session-20190705-152703

[15:29:20.392843435] (+?.?????????) x1 my_probe_called: { cpu_id = 1 }, { ip = 0x4004DA }
It’s worth mentioning that the 2.11 implementation only supports tracing SDT probes that are not guarded by semaphore. For now, no probe parameters are extracted.
It's possible to compile LTTng-UST tracepoints with SDT probes built-in by
manually configuring the LTTng-UST project with the --with-sdt
flag.
Conclusion
This article has provided a quick overview of the new dynamic user space tracing feature coming in LTTng 2.11. Tracing library functions and SDT probes offers a non-intrusive way to understand the behavior of your applications and libraries, making it perfect for use in production.