Tracing Java applications on Linux using the LTTng-UST Java agent

Hi everyone! Alexandre here.
In this blog post, I will demonstrate how to generate LTTng traces from the Trace Compass viewer using the LTTng-UST Java agent integration. This should effectively explain:
- How to obtain LTTng traces from any Java application instrumented with
java.util.loggingtracepoints. - How to trace the Trace Compass application.
This is basically an update of Tutorial: Tracing Java Logging Frameworks for LTTng 2.7 and above. I will also go into more details regarding how to use configuration files and how to record Trace Compass traces.
Requirements
If you want to follow this post, make sure you have the following projects:
-
LTTng-UST ≥ 2.7 with the Java agent component.
If you build LTTng-UST from source, make sure you pass the
--enable-java-agent-julorenable-java-agent-alloption to theconfigurescript, which are not enabled by default.Most binary distributions also carry packages for the Java agent. For example, on Debian and Ubuntu, it is part of the
liblttng-ust-agent-javapackage. -
Trace Compass ≥ 2.1 (currently only available in the development snapshots, or the Git master branch).
Try out the LTTng-UST Java agent
java.util.logging
(JUL) works by defining
Logger
and
Handler
objects. Loggers are part of the Java application: they receive log
calls once the execution reaches pre-determined log points. Handlers
are attached to loggers: they process the received log points to
generate and save log events wherever they are configured to do so (to a
file, to the console, over the network, or in our case, to an LTTng
trace).
The nice part is that, while the application has to define its loggers, it does not have to know about handlers at all. Those can be provided at run time, independently of the application being logged. More on this below.
There is a simple Java program example present in the LTTng-UST source tree. Let's take a look at it:
public class Hello {

    /** Class-wide JUL logger object */
    private static final Logger LOGGER = Logger.getLogger(Hello.class.getName());

    public static void main(String args[]) throws IOException {

        /* Instantiate a LTTngLogHandler object, and attach it to our logger */
        Handler lttngHandler = new LttngLogHandler();
        LOGGER.addHandler(lttngHandler);

        /* Log events using the JUL Logger created before. */
        LOGGER.info("Hello World, the answer is " + 42);
        LOGGER.info("Another info event");
        LOGGER.severe("A severe event");

        /* Cleanup */
        LOGGER.removeHandler(lttngHandler);
        lttngHandler.close();
    }
}
You can compile the example by going to the doc/examples/java-jul
and running make. Then you can run it:
java -classpath /usr/local/share/java/*:. -Djava.library.path=/usr/local/lib Hello
In the last command line:
-classpathindicates the class path, or where to look for Java classes. Here, I pointed to the location of thelttng-ust-agent-jul.jarfile, as well as.sinceHello.classis located in the current working directory.-Djava.library.pathis the equivalent ofLD_LIBRARY_PATH, but for the Java virtual machine (JVM). Here, it points to the directory containing theliblttng-ust-jul-jni.sonative library.
With these specific paths, I assume that LTTng-UST is installed from source
into /usr/local. If you installed LTTng-UST to a different location,
you need to update the paths accordingly.
This is a bit clunky, but it is just an example program. A conventional Java application could be packaged in a JAR file that advertises its dependencies explicitly. Also, in this example, the application instantiates the log handler itself. In more advanced use cases, as you will see below, handlers can be specified in a configuration file, so that they are transparent to the application.
By default, in the JVM, a ConsoleHandler object is attached to the
root logger, which means that all log messages of level INFO and above
are printed to the console. If you run the previous example, you should
get:
Jul 15, 2016 1:50:00 AM Hello main
INFO: Hello World, the answer is 42
Jul 15, 2016 1:50:01 AM Hello main
INFO: Another info event
Jul 15, 2016 1:50:01 AM Hello main
SEVERE: A severe event
This is nice, but not sufficient for us: we want the results in an LTTng
trace! Let's create a tracing session, enable LTTng events targetting
the JUL (--jul) domain, and start it:
lttng create
lttng enable-event --jul --all
lttng start
Now run the example again:
java -classpath /usr/local/share/java/*:. -Djava.library.path=/usr/local/lib Hello
Finally, stop the tracing session, inspect the recorded events, and destroy the tracing session.
lttng stop
lttng view
lttng destroy
The lttng view command shows the expected log records as LTTng
events:
[02:02:13.849817670] (+?.?????????) sonoshee lttng_jul:event: { cpu_id = 5 }, { msg = "Hello World, the answer is 42", logger_name = "Hello", class_name = "Hello", method_name = "main", long_millis = 1468562533846, int_loglevel = 800, int_threadid = 1 }
[02:02:13.884177233] (+0.034359563) sonoshee lttng_jul:event: { cpu_id = 5 }, { msg = "Another info event", logger_name = "Hello", class_name = "Hello", method_name = "main", long_millis = 1468562533884, int_loglevel = 800, int_threadid = 1 }
[02:02:13.885255957] (+0.001078724) sonoshee lttng_jul:event: { cpu_id = 5 }, { msg = "A severe event", logger_name = "Hello", class_name = "Hello", method_name = "main", long_millis = 1468562533885, int_loglevel = 1000, int_threadid = 1 }
Use a java.util.logging configuration file
The previous example had the application define the log handler itself. In most real world use cases, the application would only take care of defining loggers, and handlers would be configured at run time by providing a JUL configuration file. Oracle's Using the JRE Logging Configuration File document is not particularly exhaustive, but should give a good idea of how it works. Plenty examples can be found on the Internet too.
For example, let's rerun the previous example, but this time with
a configuration file defining a FileHandler handler. The
configuration file, let's call it logging.properties, contains:
handlers = java.util.logging.FileHandler
java.util.logging.FileHandler.pattern = %h/program.log
java.util.logging.FileHandler.formatter = java.util.logging.SimpleFormatter
The %h token means your user's home directory.
Run the program, specifying the path to the configuration
file using the -Djava.util.logging.config.file option:
java -classpath /usr/local/share/java/*:. \
     -Djava.library.path=/usr/local/lib \
     -Djava.util.logging.config.file=/path/to/logging.properties \
     Hello
The generated log file contains the expected log events:
cat ~/program.log
Jul 15, 2016 2:20:14 AM Hello main
INFO: Hello World, the answer is 42
Jul 15, 2016 2:20:15 AM Hello main
INFO: Another info event
Jul 15, 2016 2:20:15 AM Hello main
SEVERE: A severe event
Note that both handlers and loggers have their own log levels, which
by default are set to INFO. If you want to log lower-level messages,
like FINE and below, you need to set the .level property of both
the loggers and handlers you want to use.
Trace the Trace Compass application
With all this knowledge in hand, we can now record Trace Compass traces!
As a decent Java application, Trace Compass itself does not define any
log handlers, and expects that an external configuration file defines
them like we did previously. In fact, Trace Compass
disables all logging for the org.eclipse.tracecompass namespace
unless the -Dorg.eclipse.tracecompass.logging=true property is passed.
This default behaviour exists for performance reasons.
First, let us create the JUL configuration file that defines an
LTTng-UST Java agent log handler. Let's call
it logging-ust-tc.properties:
org.eclipse.tracecompass.level = ALL
org.eclipse.tracecompass.handlers = org.lttng.ust.agent.jul.LttngLogHandler
org.eclipse.tracecompass.useParentHandlers = false
org.lttng.ust.agent.jul.LttngLogHandler.level = ALL
In large applications, it's not uncommon to have several components log
to java.util.logging loggers. In our case, we are only interested in
the org.eclipse.tracecompass.* events. This is why we attach the
handler only to that logger. We also use useParentHandlers = false to
avoid leaking into the default ConsoleHandler handler or whatever
other handlers may be defined manually by other components.
Before going any further, let's mention that Trace Compass, as an Eclipse application, makes use of the Equinox OSGi framework. OSGi, in general, is extremely paranoid about all class dependencies, and normally forbids loading classes or native libraries whose dependency has not been explicitly set by a bundle. This really goes against what we're trying to do here, which is to attach a log handler and make the application completely oblivious about it.
Fortunately, there is a workaround: instead of using the regular
-classpath and -Djava.library.path arguments, you can use
-Xbootclasspath and -Dsun.boot.java.library.path, which
forces those paths onto the boot class loader's configuration and
allows loading the LTTng-UST Java agent JAR and shared object files
into the program.
Be careful!-Xbootclasspath
and -Dsun.boot.library.path are really low-level
JVM options, and should be used with care. Make sure you understand
what they do, and do not blindly load any class in there. We have
not found any side-effect of using those with the LTTng-UST
Java agent, but be warned.
Now, you just need to start Trace Compass by passing the following VM arguments:
-Xbootclasspath/a:/usr/local/share/java/lttng-ust-agent-jul.jar:/usr/local/share/java/lttng-ust-agent-common.jar
-Dsun.boot.library.path=/usr/local/lib
-Djava.util.logging.config.file=/path/to/logging-ust-tc.properties
-Dorg.eclipse.tracecompass.logging=true
They can be specified on the command line, after -vmargs:
./tracecompass -vmargs \
               -Xbootclasspath/a:/usr/local/share/java/lttng-ust-agent-jul.jar:/usr/local/share/java/lttng-ust-agent-common.jar \
               -Dsun.boot.library.path=/usr/local/lib \
               -Djava.util.logging.config.file=/path/to/logging-ust-tc.properties \
               -Dorg.eclipse.tracecompass.logging=true
If you run Trace Compass from an Eclipse development environment, the VM arguments can be set in the VM arguments section of the run configuration:
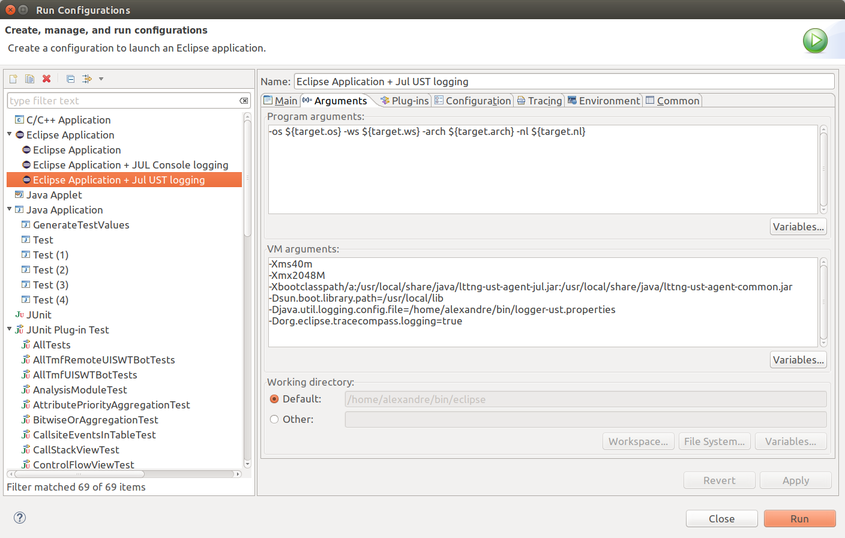
Eclipse run configuration with the required VM arguments
Again, you might have to tweak the paths according to your installation.
Create an LTTng tracing session, enable all JUL events, and start tracing:
lttng create
lttng enable-event --jul --all
lttng start
Once you're done, stop tracing and inspect the events recorded so far:
lttng stop
lttng view
Here's a sample of what I get:
Trace directory: /home/alexandre/lttng-traces/auto-20160715-032021

[03:27:16.369288260] (+?.?????????) sonoshee lttng_jul:event: { cpu_id = 6 }, { msg = "[TimeGraphView:LoadingTrace] trace=64-bit", logger_name = "org.eclipse.tracecompass.internal.analysis.os.linux.ui.views.controlflow.ControlFlowView", class_name = "org.eclipse.tracecompass.tmf.ui.views.timegraph.AbstractTimeGraphView", method_name = "loadTrace", long_millis = 1468567636368, int_loglevel = 800, int_threadid = 1 }
[03:27:16.369618897] (+0.000330637) sonoshee lttng_jul:event: { cpu_id = 6 }, { msg = "[TimeGraphView:RefreshRequested]", logger_name = "org.eclipse.tracecompass.internal.analysis.os.linux.ui.views.controlflow.ControlFlowView", class_name = "org.eclipse.tracecompass.tmf.ui.views.timegraph.AbstractTimeGraphView", method_name = "refresh", long_millis = 1468567636369, int_loglevel = 800, int_threadid = 1 }
[03:27:16.373662440] (+0.004043543) sonoshee lttng_jul:event: { cpu_id = 7 }, { msg = "[TimeGraphView:BuildThreadStart] trace=64-bit", logger_name = "org.eclipse.tracecompass.internal.analysis.os.linux.ui.views.controlflow.ControlFlowView", class_name = "org.eclipse.tracecompass.tmf.ui.views.timegraph.AbstractTimeGraphView$BuildThread", method_name = "run", long_millis = 1468567636373, int_loglevel = 800, int_threadid = 42 }
[03:27:16.375294339] (+0.001631899) sonoshee lttng_jul:event: { cpu_id = 7 }, { msg = "[TimeGraphView:BuildThreadEnd]", logger_name = "org.eclipse.tracecompass.internal.analysis.os.linux.ui.views.controlflow.ControlFlowView", class_name = "org.eclipse.tracecompass.tmf.ui.views.timegraph.AbstractTimeGraphView$BuildThread", method_name = "run", long_millis = 1468567636375, int_loglevel = 800, int_threadid = 42 }
[03:27:16.642176684] (+0.266882345) sonoshee lttng_jul:event: { cpu_id = 1 }, { msg = "[TimeGraphView:RefreshStart]", logger_name = "org.eclipse.tracecompass.internal.analysis.os.linux.ui.views.controlflow.ControlFlowView", class_name = "org.eclipse.tracecompass.tmf.ui.views.timegraph.AbstractTimeGraphView$6", method_name = "run", long_millis = 1468567636642, int_loglevel = 800, int_threadid = 1 }
[03:27:16.738085522] (+0.095908838) sonoshee lttng_jul:event: { cpu_id = 1 }, { msg = "[TimeGraphView:RefreshEnd]", logger_name = "org.eclipse.tracecompass.internal.analysis.os.linux.ui.views.controlflow.ControlFlowView", class_name = "org.eclipse.tracecompass.tmf.ui.views.timegraph.AbstractTimeGraphView$6", method_name = "run", long_millis = 1468567636737, int_loglevel = 800, int_threadid = 1 }
[03:29:18.167467846] (+121.429382324) sonoshee lttng_jul:event: { cpu_id = 5 }, { msg = "[StateSystem:FullQueryStart] ssid=org.eclipse.linuxtools.lttng2.ust.analysis.debuginfo, ts=1468529011041066742", logger_name = "org.eclipse.tracecompass.internal.statesystem.core.StateSystem", class_name = "org.eclipse.tracecompass.internal.statesystem.core.StateSystem", method_name = "queryFullState", long_millis = 1468567758167, int_loglevel = 800, int_threadid = 1 }
[03:29:18.169179684] (+0.001711838) sonoshee lttng_jul:event: { cpu_id = 5 }, { msg = "[StateSystem:FullQueryEnd]", logger_name = "org.eclipse.tracecompass.internal.statesystem.core.StateSystem", class_name = "org.eclipse.tracecompass.internal.statesystem.core.StateSystem", method_name = "queryFullState", long_millis = 1468567758169, int_loglevel = 800, int_threadid = 1 }
...
You could even open the Trace Compass trace into Trace Compass itself:
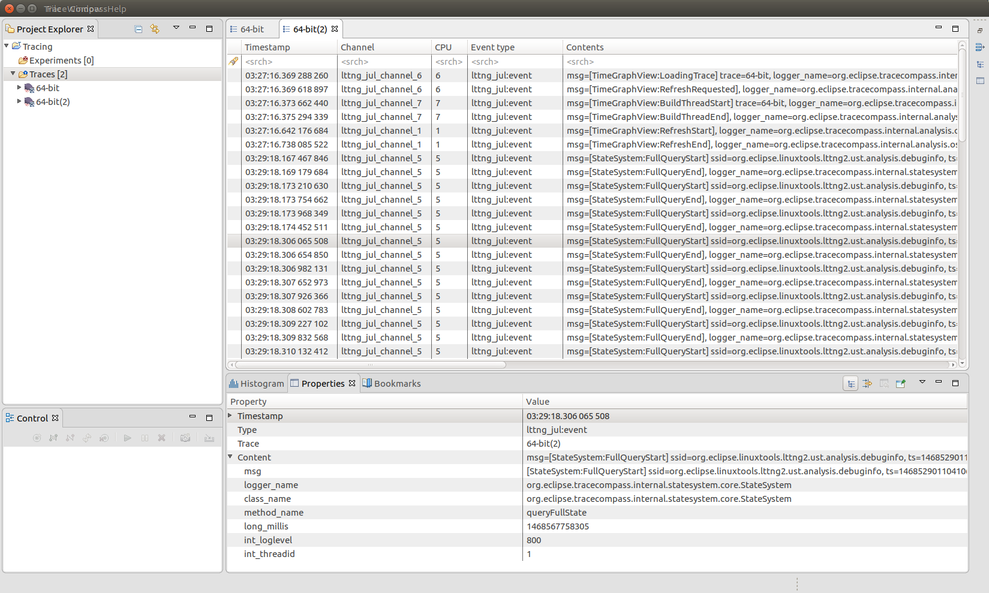
Trace Compass LTTng-UST trace opened in Trace Compass
We've come full circle!
Trace specific components
You'll notice quite quickly that the StateSystem:*QueryStart events,
for example, are very spammy, and if you are not interested in those, it
would be useful to stop tracing them and only trace the components you
are interested in. There are two ways to achieve this.
Use LTTng-UST filtering
In regular, native applications, you can enable specific LTTng events
based on their names. With the LTTng-UST Java agent,
however, all tracepoints share the same LTTng-UST event name, which is
lttng_jul:event for the JUL handler. This means that the
lttng enable-event command works a bit differently for the Java
domains: it actually filters on the logger name, as opposed to the
LTTng-UST event name itself.
For example, assuming you have started Trace Compass as we did previously, you can create a tracing session and enable JUL events as follows:
lttng create
lttng enable-event --jul 'org.eclipse.tracecompass.tmf.ui.views.callstack*'
lttng start

# Do some operations involving the Callstack View

lttng stop
lttng view
lttng destroy
The lttng view command outputs something like this:
[04:11:16.747726586] (+?.?????????) sonoshee lttng_jul:event: { cpu_id = 7 }, { msg = "[TimeGraphView:LoadingTrace] trace=64-bit", logger_name = "org.eclipse.tracecompass.tmf.ui.views.callstack.CallStackView", class_name = "org.eclipse.tracecompass.tmf.ui.views.timegraph.AbstractTimeGraphView", method_name = "loadTrace", long_millis = 1468570276747, int_loglevel = 800, int_threadid = 1 }
[04:11:16.747782211] (+0.000055625) sonoshee lttng_jul:event: { cpu_id = 7 }, { msg = "[TimeGraphView:RefreshRequested]", logger_name = "org.eclipse.tracecompass.tmf.ui.views.callstack.CallStackView", class_name = "org.eclipse.tracecompass.tmf.ui.views.timegraph.AbstractTimeGraphView", method_name = "refresh", long_millis = 1468570276747, int_loglevel = 800, int_threadid = 1 }
[04:11:16.749022852] (+0.001240641) sonoshee lttng_jul:event: { cpu_id = 5 }, { msg = "[TimeGraphView:BuildThreadStart] trace=64-bit", logger_name = "org.eclipse.tracecompass.tmf.ui.views.callstack.CallStackView", class_name = "org.eclipse.tracecompass.tmf.ui.views.timegraph.AbstractTimeGraphView$BuildThread", method_name = "run", long_millis = 1468570276748, int_loglevel = 800, int_threadid = 91 }
[04:11:16.910564300] (+0.161541448) sonoshee lttng_jul:event: { cpu_id = 7 }, { msg = "[TimeGraphView:RefreshStart]", logger_name = "org.eclipse.tracecompass.tmf.ui.views.callstack.CallStackView", class_name = "org.eclipse.tracecompass.tmf.ui.views.timegraph.AbstractTimeGraphView$6", method_name = "run", long_millis = 1468570276910, int_loglevel = 800, int_threadid = 1 }
[04:11:16.935026917] (+0.024462617) sonoshee lttng_jul:event: { cpu_id = 7 }, { msg = "[TimeGraphView:RefreshEnd]", logger_name = "org.eclipse.tracecompass.tmf.ui.views.callstack.CallStackView", class_name = "org.eclipse.tracecompass.tmf.ui.views.timegraph.AbstractTimeGraphView$6", method_name = "run", long_millis = 1468570276934, int_loglevel = 800, int_threadid = 1 }
[04:11:16.935888918] (+0.000862001) sonoshee lttng_jul:event: { cpu_id = 1 }, { msg = "[TimeGraphView:ZoomThreadStart] start=-9223372036854775808, end=9223372036854775807", logger_name = "org.eclipse.tracecompass.tmf.ui.views.callstack.CallStackView", class_name = "org.eclipse.tracecompass.tmf.ui.views.timegraph.AbstractTimeGraphView$ZoomThread", method_name = "run", long_millis = 1468570276935, int_loglevel = 800, int_threadid = 94 }
[04:11:16.936177751] (+0.000288833) sonoshee lttng_jul:event: { cpu_id = 1 }, { msg = "[TimeGraphView:ZoomThreadGettingStates]", logger_name = "org.eclipse.tracecompass.tmf.ui.views.callstack.CallStackView", class_name = "org.eclipse.tracecompass.tmf.ui.views.timegraph.AbstractTimeGraphView$ZoomThreadByEntry", method_name = "doRun", long_millis = 1468570276936, int_loglevel = 700, int_threadid = 94 }
[04:11:16.936699963] (+0.000522212) sonoshee lttng_jul:event: { cpu_id = 1 }, { msg = "[TimeGraphView:ZoomThreadGettingLinks]", logger_name = "org.eclipse.tracecompass.tmf.ui.views.callstack.CallStackView", class_name = "org.eclipse.tracecompass.tmf.ui.views.timegraph.AbstractTimeGraphView$ZoomThreadByEntry", method_name = "doRun", long_millis = 1468570276936, int_loglevel = 700, int_threadid = 94 }
[04:11:16.937257688] (+0.000557725) sonoshee lttng_jul:event: { cpu_id = 1 }, { msg = "[TimeGraphView:ZoomThreadGettingMarkers]", logger_name = "org.eclipse.tracecompass.tmf.ui.views.callstack.CallStackView", class_name = "org.eclipse.tracecompass.tmf.ui.views.timegraph.AbstractTimeGraphView$ZoomThreadByEntry", method_name = "doRun", long_millis = 1468570276937, int_loglevel = 700, int_threadid = 94 }
[04:11:16.945664597] (+0.008406909) sonoshee lttng_jul:event: { cpu_id = 1 }, { msg = "[TimeGraphView:RedrawRequested]", logger_name = "org.eclipse.tracecompass.tmf.ui.views.callstack.CallStackView", class_name = "org.eclipse.tracecompass.tmf.ui.views.timegraph.AbstractTimeGraphView", method_name = "redraw", long_millis = 1468570276945, int_loglevel = 800, int_threadid = 94 }
...
Notice that we only obtain events in which the logger_name field is
within the org.eclipse.tracecompass.tmf.ui.views.callstack namespace.
What happens here is that the LTTng-UST Java agent sends all log records through a Java Native Interface (JNI), and LTTng-UST filters out those that do not match the requirements of the tracing session.
Tweak the java.util.logging configuration
Alternatively, it is also possible to filter events at the JUL level, by changing the contents of the configuration file.
If you want to
trace only the org.eclipse.tracecompass.tmf.ui.views.callstack
namespace, as we did previously, you can create a new JUL configuration
file with the following contents. Let's call it
logging-ust-tc-callstack.properties:
org.eclipse.tracecompass.level = OFF

org.eclipse.tracecompass.tmf.ui.views.callstack.handlers = org.lttng.ust.agent.jul.LttngLogHandler
org.eclipse.tracecompass.tmf.ui.views.callstack.level = ALL
org.eclipse.tracecompass.tmf.ui.views.callstack.useParentHandlers = false

org.lttng.ust.agent.jul.LttngLogHandler.level = ALL
Note how we disable all org.eclipse.tracecompass tracing, except for
the one component we are interested in.
Next, set up an LTTng tracing session as usual, this time using
lttng enable-event --jul --all to enable all JUL events.
Restart Trace Compass, but make the
-Djava.util.logging.config.file option point to the
logging-ust-tc-callstack.properties file you just created.
The resulting trace should be similar to what we obtained previously,
with only events from the org.eclipse.tracecompass.tmf.ui.views.callstack
loggers being present.
Which approach should I use?
As we've seen, both filtering approaches accomplish the same goal.
The first one might be easier to set up and more flexible, since settings can be changed without having to restart the traced application. From a pure performance perspective, however, the second approach might be a little bit more efficient, since events that must not be recorded to the trace are not be sent through the JNI at all.
Setting the log level of unused loggers to OFF is also a great help,
as it completely avoids the creation of the corresponding log record
objects, including potentially costly string concatenation operations.
Feel free to join the LTTng community if you have any question or hit any problem with the steps in this post.
Happy Java tracing!