Saving memory on many-core hosts with LTTng 2.14

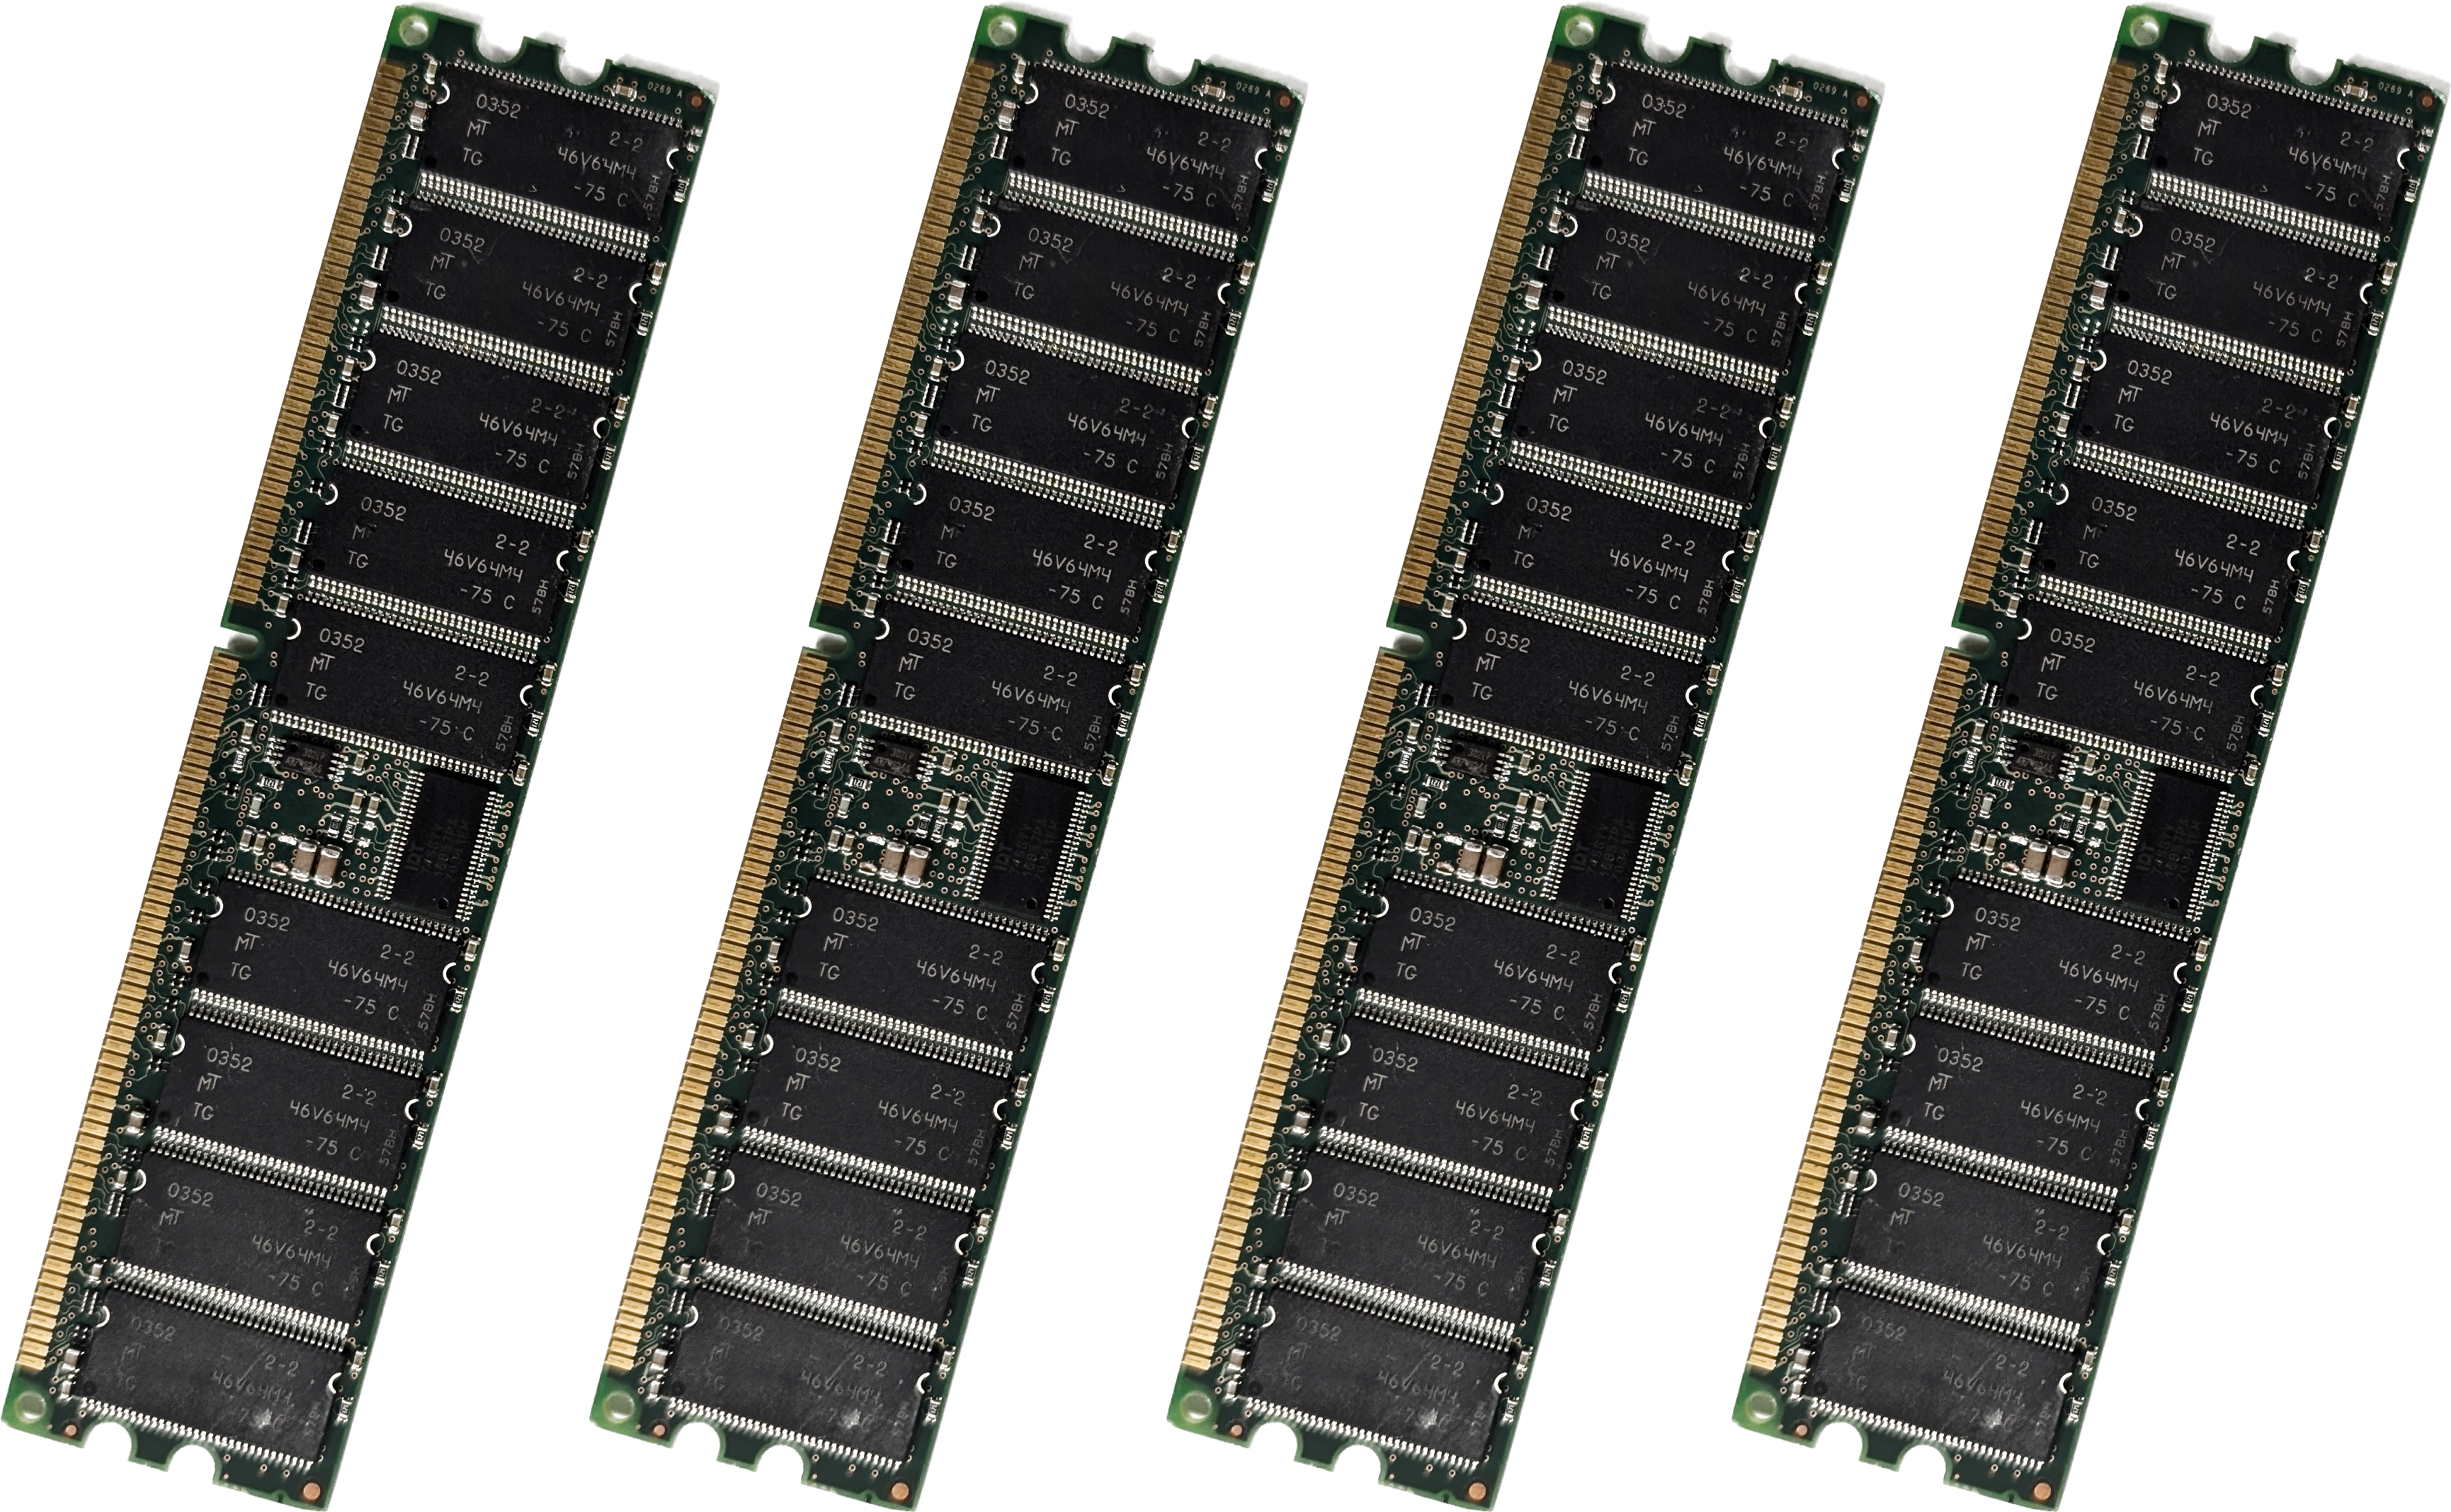
LTTng's per-CPU ring buffers have kept tracing overhead at a minimum for years. But while servers once sported a handful of cores, they now ship with hundreds of hardware threads. Give every one of those CPUs its own LTTng per-CPU ring buffer and your trace infrastructure can swallow gigabytes of RAM before your workload even starts—especially in container-dense deployments.
LTTng 2.14 fixes that with an optional per-channel buffer allocation policy that keeps the memory consumption independent of the number of CPUs while adding only a modest overhead except for the most event-heavy, CPU-intensive traces.
Per-CPU buffers: the memory-usage problem
When LTTng's design was laid down in 2008, mainstream servers had a handful of cores: Intel's Xeon 7300 packed four per socket, and the just-announced Xeon 7400 finally reached six. In that context, per-CPU ring buffers were the obvious way to avoid cache-line bouncing and the extra memory cost barely showed up on the bill.
Fast-forward to 2025 and LTTng, on current-gen hardware, must contend with increasingly core-dense machines that present hundreds of logical cores to the operating system.
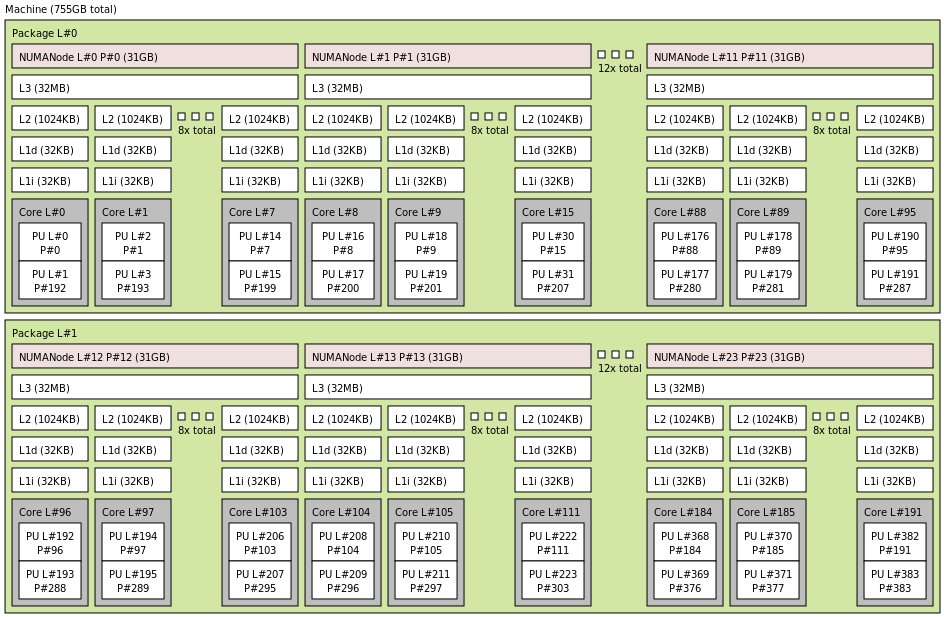
For example, take one of our lab boxes: a dual-socket server built around AMD EPYC 9654 processors. Each socket carries 96 cores and 192 threads, meaning the Linux kernel sees 384 logical CPUs.

LTTng still hands every one of those CPUs its own ring buffer—four 512 KiB sub-buffers, or 2 MiB total:
- One user, one channel, one recording session
- 384 CPUs × 2 MiB = 768 MiB
That's three quarters of a gigabyte of RAM gone before your applications even handle a single byte of data.
Now drop the same tracing configuration into ten containers and the bill jumps to 7.68 GiB.
Of course, you can trim
--subbuf-size
and
--num-subbuf
when you create the channel,
but smaller buffers overflow easily during the very bursts you're trying
to capture, leaving holes in the trace.
Per-CPU buffers were a no-brainer when six-core boxes were “big iron.” On today's many-core hosts though, they devour memory.
The fix: per-channel buffers
Starting from LTTng 2.14,
you can specify a buffer allocation policy using the
lttng enable-channel
command. In concrete terms, this lets you decide how many ring buffers a
user space channel uses:
- Per-CPU (default)
- The familiar “one buffer per logical CPU”.
- Per-channel (new!)
- One buffer shared by every CPU.
Below is a minimal session that uses the new allocation policy. We also
add the cpu_id context to all event, so you still know where each of
them occurred:
$


$

$

$

$

$


$


$
lttng create
Session auto-20250424-140204 created.
Traces will be output to /home/user/lttng-traces/auto-20250424-140204
lttng enable-channel -u --buffer-allocation=per-channel my-channel
user space channel `my-channel` enabled for session `auto-20250424-140204`
lttng add-context -u --channel=my-channel --type=cpu_id
user space context cpu_id added to channel my-channel
lttng enable-event -u --all -c my-channel
Enabled user space event rule matching all events and attached to channel `my-channel`
lttng start
Tracing started for session `auto-20250424-140204`
# Run `demo-trace` program available alongside `/usr/share/doc/lttng-ust/examples/demo/README.md`
Demo program starting.
Tracing...  done.
lttng stop
Waiting for data availability
Tracing stopped for session `auto-20250424-140204`
lttng view
[...]
[14:08:04.642744881] (+0.000435675) thinkos ust_tests_demo:starting:
  { cpu_id = 10 }, {
    value = 123
  }
[14:08:04.642752074] (+0.000007193) thinkos ust_tests_demo2:loop:
  { cpu_id = 10 },
  {
    intfield = 0,
    intfield2 = 0x0,
    longfield = 0,
    netintfield = 0,
    netintfieldhex = 0x0,
    arrfield1 = [ [0] = 1, [1] = 2, [2] = 3 ],
    arrfield2 = "test",
    _seqfield1_length = 4,
    seqfield1 = [ [0] = 116, [1] = 101, [2] = 115, [3] = 116 ],
    _seqfield2_length = 4,
    seqfield2 = "test",
    stringfield = "test",
    floatfield = 2222,
    doublefield = 2
  }
[...]
To validate, we can see that only two unlinked shared memory files exist with the LTTng consumer daemon holding file descriptors referencing them: a 16 KiB file backing the trace metadata, and a 2.5 MiB file backing the tracing ring buffers.
$


$


$
for pid in $(pidof lttng-consumerd); do echo "PID: $pid"; ls -alrt /proc/$pid/fd/ | grep shm-ust-consumer; done
PID: 2948252
PID: 2948250
lrwx------ 1 user group 64 Apr 24 14:15 36 -> /dev/shm/shm-ust-consumer-2948250 (deleted)
lrwx------ 1 user group 64 Apr 24 14:15 34 -> /dev/shm/shm-ust-consumer-2948250 (deleted)
stat -L /proc/2948250/fd/36
[...]
Size: 16608 Blocks: 40 IO Block: 4096 regular file
stat -L /proc/2948250/fd/34
[...]
Size: 2625920 Blocks: 5136 IO Block: 4096 regular file
Finally, we can observe that a single data stream file contains data for
my-channel (my-channel_0) in the trace output directory:
$
tree /home/user/lttng-traces/auto-20250424-140204
/home/user/lttng-traces/auto-20250424-140204
└── ust
    └── uid
        └── 1000
            └── 64-bit
                ├── index
                │   └── my-channel_0.idx
                ├── metadata
                └── my-channel_0

6 directories, 3 files
Performance trade-offs
Per-channel buffers are not a drop-in win for every workload: they help reduce memory use by letting all logical CPUs share a single ring buffer, but that shared buffer becomes a point of contention. As trace traffic rises—especially when many CPUs are writing simultaneously—the tracing overhead climbs accordingly.
If that extra overhead is a concern, we encourage you to stick with the default per-CPU buffer allocation policy. Or, watch for the sparse-file-backed per-CPU buffers landing in LTTng 2.15, which aim to marry per-CPU performance with per-channel memory usage.
Try it today and tell us what you think!
Grab LTTng 2.14-rc1, use the new
--buffer-allocation=per-channel
option when you create a user space channel, and
let us know how it works for your workloads.
Your feedback is always appreciated!
Happy tracing!