LTTng session rotation: the practical way to do continuous tracing

Many LTTng users want to inspect traces while their tracing session continues to run in the background, but that's only possible with tools that support the "live" protocol. Historically, it has not been possible to process traces "offline". To be able to read, modify, or delete a trace file, you need to interrupt the tracing session. When you're investigating long-lived issues that can take days to track down, stopping the session to see whether the bug has triggered opens a window where you might miss it. And leaving the session running can result in huge traces that can take days to process.
To solve these problems, LTTng 2.11 introduces a new feature: tracing session
rotation. Using the lttng rotate and lttng enable-rotation commands, it's
now possible to create self-contained trace archives on-demand that you can
analyze while tracing continues in the background.
What is "session rotation"?
Session rotation is a way to create complete, self-contained traces. When a session is rotated, the trace data is no longer owned by LTTng, which means you can read, modify, and delete the trace files without affecting the current tracing session.
This feature is handy for situations where you want to inspect the trace data captured so far but don't want to pause tracing or work with huge traces. One caveat is that tracing session rotation only works if the tracing session is created in normal mode or network streaming mode: it does not work with live or snapshot sessions.
The trace data in the LTTng ring buffers, along with any trace data that has already been written, is known as the current trace chunk. Rotating a tracing session forces the current trace chunk and associated metadata to be written to a directory called the trace chunk archive. Essentially, a tracing session rotation archives the current trace chunk.
There are two ways to rotate a session: manually and automatically.
You can trigger tracing session rotation by using the lttng rotate
command. The lttng rotate command prints the path to the new trace
chunk archive. Here's the output of a tracing session that
demonstrates the session rotation feature:
$
lttng create
Session auto-20190923-123650 created.
Traces will be output to /home/user/lttng-traces/auto-20190923-123650
$
lttng enable-event -k -a
All Kernel events are enabled in channel channel0
$
lttng start
Tracing started for session auto-20190923-123650
$
lttng rotate
Waiting for rotation to complete...
Trace chunk archive for session auto-20190923-123650 is now readable at
/home/user/lttng-traces/auto-20190923-123650/archives/20190923T123658-0400-20190923T123701-0400-0
$
lttng rotate
Waiting for rotation to complete...
Trace chunk archive for session auto-20190923-123650 is now readable at /home/.../20190923T123701-0400-20190923T123706-0400-1
$
lttng rotate
Waiting for rotation to complete...
Trace chunk archive for session auto-20190923-123650 is now readable at /home/.../20190923T123706-0400-20190923T123708-0400-2
$
lttng stop
Waiting for data availability.
Tracing stopped for session auto-20190923-123650
$
lttng destroy
Waiting for destruction of session "auto-20190923-123650"...
Trace chunk archive for session auto-20190923-123650 is now readable at /home/.../20190923T123708-0400-20190923T123724-0400-3
Session "auto-20190923-123650" destroyed
$
tree /home/user/lttng-traces/auto-20190923-123650
/home/user/lttng-traces/auto-20190923-123650
└── archives
    ├── 20190923T123658-0400-20190923T123701-0400-0
    │   └── kernel
    │       ├── channel0_0
    │       ├── channel0_1
    │       ├── channel0_2
    │       ├── channel0_3
    │       ├── index
    │       │   ├── channel0_0.idx
    │       │   ├── channel0_1.idx
    │       │   ├── channel0_2.idx
    │       │   └── channel0_3.idx
    │       └── metadata
    ├── 20190923T123701-0400-20190923T123706-0400-1
    │   └── kernel
    │       ├── channel0_0
    │       ├── channel0_1
    │       ├── channel0_2
    │       ├── channel0_3
    │       ├── index
    │       │   ├── channel0_0.idx
    │       │   ├── channel0_1.idx
    │       │   ├── channel0_2.idx
    │       │   └── channel0_3.idx
    │       └── metadata
    ├── 20190923T123706-0400-20190923T123708-0400-2
    │   └── kernel
    │       ├── channel0_0
    │       ├── channel0_1
    │       ├── channel0_2
    │       ├── channel0_3
    │       ├── index
    │       │   ├── channel0_0.idx
    │       │   ├── channel0_1.idx
    │       │   ├── channel0_2.idx
    │       │   └── channel0_3.idx
    │       └── metadata
    └── 20190923T123708-0400-20190923T123724-0400-3
        └── kernel
            ├── channel0_0
            ├── channel0_1
            ├── channel0_2
            ├── channel0_3
            ├── index
            │   ├── channel0_0.idx
            │   ├── channel0_1.idx
            │   ├── channel0_2.idx
            │   └── channel0_3.idx
            └── metadata
The naming scheme for trace chunk archives uses an ISO 8601-compatible timestamp marking the start and end times of the trace chunk archive, plus a trace chunk archive identifier that is guaranteed to be unique within the tracing session.
Tracing sessions can also be rotated automatically. Automatic rotation is triggered by an automatic rotation schedule which is done in one of two ways:
-
Whenever a timer expires
-
When the flushed part of the current trace chunk exceeds a configured size
Automatic rotation schedules for a tracing session are configured with
the lttng enable-rotation command. The --timer=PERIOD option sets
session rotation to occur every PERIOD microseconds. Alternatively,
the --size=SIZE option causes rotation to be triggered whenever the
total size of the flushed part of the current trace chunk is at least
‘SIZE' bytes.
The two options are not mutually exclusive but there are a number of
restrictions and the details are provided in the
lttng-enable-rotation man page.
Tracing session rotation vs. trace file rotation
Tracing session rotation is a new feature but LTTng has supported trace file rotation since 2.2.0. While the two features have similar names, they solve very different problems. The latter is a mechanism for limiting the size of traces created during a tracing session by splitting trace streams into multiple trace files and keeping a limited number on disk, overwriting old trace files when a maximum count has been reached.
How does it work?
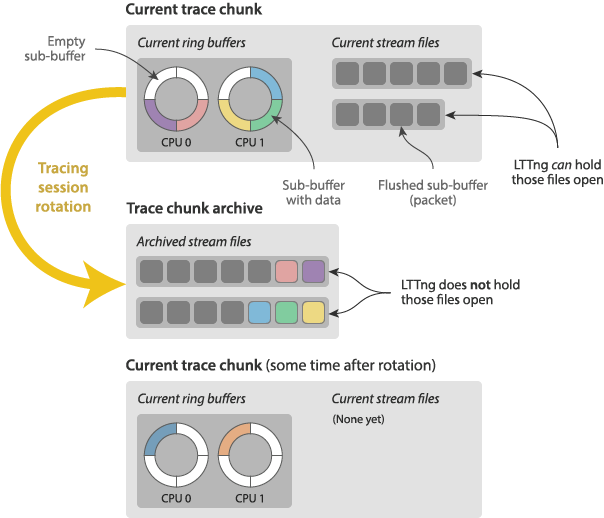
The tracing session rotation feature is inspired by log rotation, and it operates on trace chunks. The ring buffers from all CPUs, plus any existing trace files containing extracted data, are referred to as the current trace chunk. Rotating a session causes the current trace chunk to be written to a trace chunk archive.
When a session rotation is triggered, the ring buffers are flushed which means their contents are written to a trace chunk archive and then cleared. If you've used the snapshot mode, you may have found that consecutive snapshots can contain the same or overlapping data since the ring buffers aren't cleared between snapshot operations. Plus, snapshots only contain the data that is in memory at the time the snapshot operation is triggered – they do not necessarily contain all data from the tracing session. That is not a problem with session rotation, and session rotation is the preferred way to create self-contained, unique trace data files for continuous tracing.
The following diagram illustrates how tracing session rotation works:

We tried to keep the configuration simple for tracing session rotation. It doesn't require any special configuration to either the tracing session or the channels at start time, so you can trigger rotation at any point.
Coming in 2.11
The tracing session rotation feature will be available in the 2.11 release. It's a feature that has been requested many times on the lttng-dev mailing list to help keep traces small and make continuous tracing manageable, load-balance the automatic post-processing of traces, and to send trace archives to a different host for post-processing and storage. It solves a real problem for LTTng users: how to analyze trace data without interrupting their tracing session or changing their workflow to use LTTng's live mode.