Tutorial: Remotely tracing an embedded Linux system
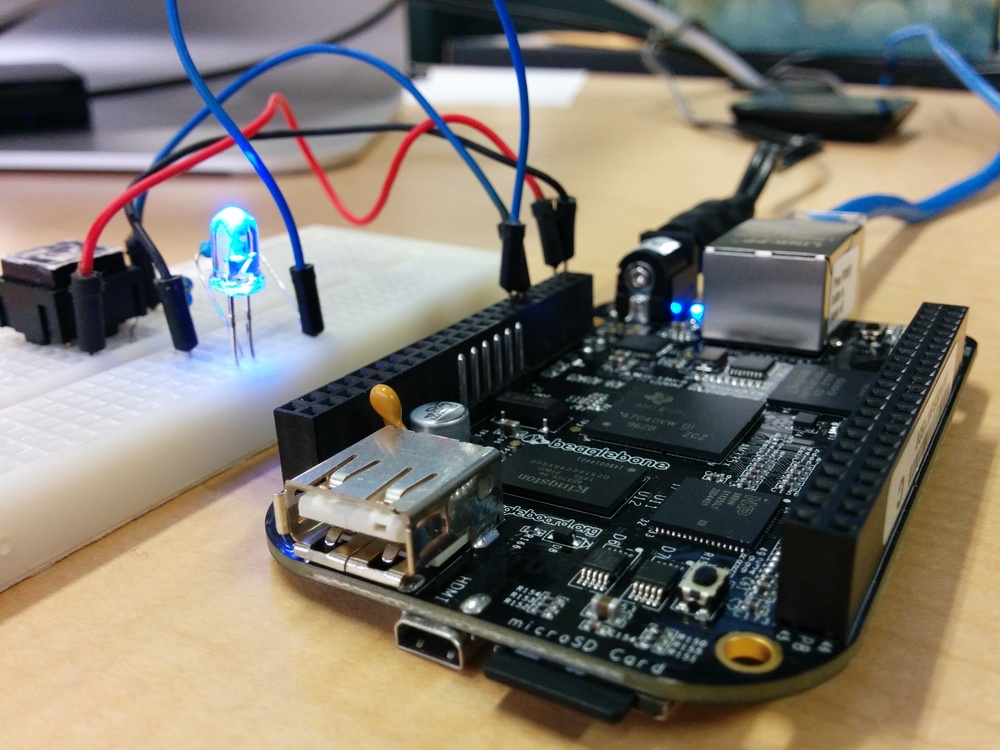
BeagleBone Black with GPIO test circuit.
Embedded systems usually present some kind of constraints, such as
limited computing power, minimal amount of memory, low or nonexistent
storage, etc. Debugging embedded systems within those constraints can be
a real challenge for developers. Sometimes, developers will fallback to
logging to a file with their beloved printf() in order to find the
issues in their software stack. Keeping these log files on the system
might not be possible.
The goal of this post is to describe a way to debug an embedded system with tracing and to stream the resulting traces to a remote machine.
Physical setup
In order to illustrate the remote trace streaming capability of LTTng, a small setup is assembled. The hardware consists of a BeagleBone Black (BBB) running Linux, and an external device interacting with the system via GPIO (a simple push-button). For reference, the push-button and pull-down resistor are connected to GPIO 31 (pin 13 on the BBB's P9 header; see pinout below).
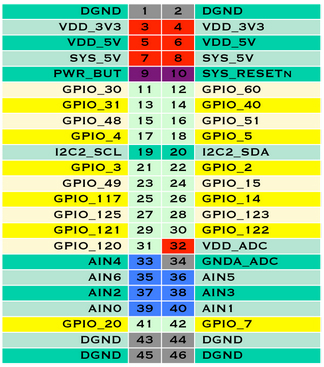
BeagleBone Black P9 header pinout
The BeagleBone is also connected via Ethernet to the local network in order to stream the resulting traces to another machine.
The idea of this setup is to be able to trigger GPIO events with the press of a push-button and send all the resulting events to a remote host for further analysis.
This can be achieved by using an LTTng relay daemon running on the host. On the software side, we need to install the LTTng toolchain on the BBB, as well as on the remote host. Refer to the official documentation for installation instructions.
Fortunately for us, Linux kernel's GPIO subsystem is already instrumented. We only need to enable the appropriate tracepoints in the kernel domain.
Playing around with GPIO pins
To have a better understanding of how the GPIOs are exposed under Linux, this tutorial might be helpful. Also, see the official Linux kernel documentation on GPIO, and the corresponding sysfs interface.
For our example, we use the following script to expose and configure the GPIO pins in our setup:
#!/bin/bash

# Setup our GPIO pins
cd /sys/class/gpio
echo 30 > export
echo in > gpio30/direction      # our push-button
echo 31 > export
echo out > gpio31/direction     # our LED

# Disable BBB LEDs, which also use the GPIO subsystem
cd /sys/class/leds
for led in beaglebone*; do
    echo "none" > $led/trigger
done
This sample program
is used to show the values from our GPIO pin. The program
poll()s the GPIO value's file
descriptor and prints any change to the standard output. A sample
output of this program is shown below (notice the interrupt messages
when the push-button is pressed):
./gpio 31
# Push-button pressed
 poll() GPIO 31 interrupt occurred
...
# Push-button unpressed
 poll() GPIO 31 interrupt occurred
Relay daemon setup (on the remote host)
In order to receive the tracing data from the target, a relay daemon needs to be listening on the host. Launching the relay daemon on the remote host is as simple as this:
lttng-relayd
The daemon is now ready to accept connections.
Tracing session setup (on the BeagleBone)
On the BeagleBone, we need to configure our tracing session to stream the trace data to our remote host.
lttng lttng create --set-url=net://192.168.1.100
lttng enable-event --kernel 'gpio_*'
lttng start
The --set-url option's argument of the lttng create command
indicates that the trace data will be streamed to the machine with IP
address 192.168.1.100 (our host). The second command enables the GPIO
direction and value change events in the kernel
domain. Finally, the lttng start
command activates tracing.
Now that tracing is active, when we press the push-button, a GPIO event is fired, and it is is streamed to our remote host.
Before analyzing the resulting remote trace with a viewer, we need to
make sure that tracing is stopped on the BBB, which is done with
the lttng stop command:
lttng stop
lttng destroy
The destroy command ensures that all session resources are freed.
Viewing the traces
On the remote host, we can now launch the Babeltrace viewer on the resulting trace:
babeltrace ~/lttng-traces/beaglebone/<trace name>
The LTTng relay daemon, without a special configuration, outputs its
traces into subdirectories of the ~/lttng-traces directory,
corresponding to host names. Our BBB's host name is beaglebone.
The result of running babeltrace is:
[15:20:07.235343543] (+?.?????????) alarm gpio_value: { cpu_id = 0 }, { gpio = 30, get = 1, value = 1 }
[15:20:07.337106714] (+0.101763171) alarm gpio_value: { cpu_id = 0 }, { gpio = 30, get = 1, value = 1 }
[15:20:07.338400968] (+0.001294254) alarm gpio_value: { cpu_id = 0 }, { gpio = 30, get = 1, value = 0 }
[15:20:08.656489977] (+1.318089009) alarm gpio_value: { cpu_id = 0 }, { gpio = 30, get = 1, value = 1 }
[15:20:08.737528488] (+0.081038511) alarm gpio_value: { cpu_id = 0 }, { gpio = 30, get = 1, value = 1 }
[15:20:08.750590177] (+0.013061689) alarm gpio_value: { cpu_id = 0 }, { gpio = 30, get = 1, value = 0 }
By pressing the push-button, a value of 1 is recorded to the
trace. When unpressed, a value of 0 is recorded. In the trace
above, the push-button was pressed only two times. The extra 1
values can be attributed to the
contact bounce
of our mechanical switch.
Conclusion
The goal of this simplistic example was to introduce the streaming capabilities of the LTTng toolchain.