barectf 2: Continuous Bare-Metal Tracing on the Parallella Board
Photo: Julien Desfossez
My last post,
Tracing Bare-Metal Systems: a Multi-Core Story,
written back in November 2014, introduced a command-line
tool named barectf which would output C functions that are able to
produce native CTF binary streams out of a CTF metadata input.
Today, I am very happy to present barectf 2, a natural evolution of what could now be considered my first prototype. The most considerable feature of barectf 2 is its platform concept: prewritten C code for a specific target managing the opening and closing operations of packets, effectively allowing continuous tracing from the application's point of view.
This post, like my previous one, explores the practical case of the Parallella board. This system presents a number of interesting challenges. To make a long story short, a bare-metal application being traced is running on the 16-core Epiphany, therefore producing a stream of packets, which must be extracted (or consumed) on the ARM (host) side.
What's New in barectf 2?
barectf 0.x underwent major changes to become barectf 2:
- Platforms allow packet management to be performed outside the application code
- Configuration is written in YAML; the CTF trace's metadata file is now generated
- Various optimizations in the generated C code
The following subsections present those differences individually.
barectf Platforms: Packet Management Outside the Application
With barectf 0.x, you had to handle the return value of each tracing function and manually close and write the current packet somewhere before opening a new one and calling the tracing function again. This was done on the application side and, if you didn't want every tracing function call to be surrounded with this redundant logic, you needed to wrap all of them in some way.
barectf 2 addresses this problem by introducing the concept of a platform. A barectf platform is responsible for providing to the application:
- An initialization function, which takes care, for a given stream, of initializing a barectf context and opening its first packet.
- A finalization function, which closes the very last stream packets, if needed.
When initializing a barectf context, platform callbacks are registered and called when specific conditions are met (open/close the current packet, return a clock's current value, etc.).
What happens with the current packet once it is closed depends on the platform. A very simple platform could write it to the file system directly; a more sophisticated implementation could append it to a ring buffer shared with a separate consumer thread/process.
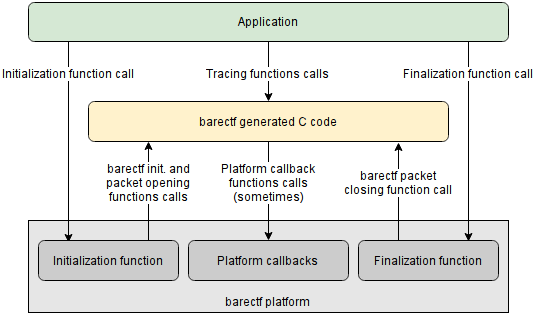
barectf 2 call graph
In all cases, the application code
does not need to deal with packet management anymore: it just needs
to initialize its chosen platform, call the tracing functions, and
finalize the platform. This is somewhat reminiscent of
LTTng-UST, for which
an application only needs to call tracepoints given that the
initialization phase is performed by liblttng-ust's constructor.
A tracing function does not return anything in barectf 2: it either succeeds (the event is serialized in the current packet) or fails when there's no space left (the context's discarded events count is then incremented). This is analogous to LTTng's discard mode, which is also non-blocking.
barectf 2 currently ships with two platform implementations:
- linux-fs: a simple platform, created for demonstration purposes, which writes packets to the file system from an application running on Linux. This platform is also able to simulate a full back-end at random times to demonstrate how events are discarded in this situation.
- parallella: a platform tailored for the Parallella system, where a ring buffer of packets is implemented in a memory area shared between the Epiphany device and the ARM host. A host-side consumer application is also provided.
Writing a custom barectf platform is possible: just follow the
Writing a barectf platform
section of barectf's README.md file.
YAML Configuration File
barectf 0.x used the CTF trace's metadata file, written in TSDL, as an input to generate the C code. While this appeared to be a good idea at first, it was actually rather limiting:
- It supported CTF 1.8 only; other versions of CTF, with different metadata grammars, could be released in the future.
- It did not allow the attachment of custom properties to types and other metadata objects not supported by TSDL's grammar.
- It did not allow useful shortcuts, such as nesting events within streams, which is reasonable for barectf's use cases considering that the metadata file is fixed and will never be updated for a given trace.
- It did not follow what tracers typically do, i.e. generating all the files of a trace. In the case of barectf 2, the "tracer" is both the command-line utility, which produces the metadata stream file, and the generated C code, which produces the binary packets.
- TSDL is a somewhat complex grammar and parsing it was slow in Python, mostly because of the project I used, pyPEG.
For all the reasons above, I decided to use YAML as the barectf 2 configuration language. YAML is a very human-friendly language to read and write.
The immediate benefits of barectf having its own configuration format are:
- The CTF 1.8 metadata file is generated out of this YAML configuration file, which means other CTF versions could be supported in the future with the same input.
- A few easy configuration shortcuts are supported:
- Assign names to log levels
- CTF type inheritance
- Streams have names (used for generating C function/structure names)
- Event objects are nested under stream objects
- Automatic generation of trace UUID, stream IDs, and event IDs
- CTF clocks have an associated C return type to generate appropriate clock callback function prototypes.
Here's how the the big picture looks like now:
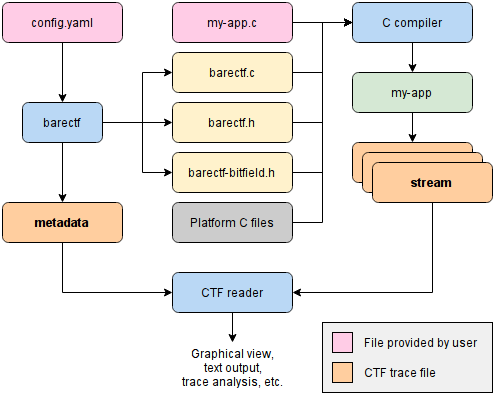
Typical barectf 2 workflow
The barectf GitHub project page has a complete documentation of all the expected YAML objects.
Optimizations to the Generated C Code
The generated C code, which contains the tracing functions code,
underwent important code size and performance optimizations. Compiling
it with -O2 or -Os will yield noticeable code size reduction,
something that's not a luxury for small embedded systems.
Notable optimizations are:
- Separate space reservation and serialization phases, which means the serialization phase does not check if the current packet is full before attempting to write each individual basic field.
- Event headers and per-stream contexts serializations have their own functions which are reused by their associated events.
- Constant offsets and sizes are used for all bitfield writing operations resulting in just a few instructions per operation.
Those optimizations are particularly welcome for targets like Adapteva's Epiphany cores: each node has 32 kiB of instruction/data memory, which must be shared with parts of libc and e-lib when needed.
Continously tracing an Epiphany application on the Parallella system
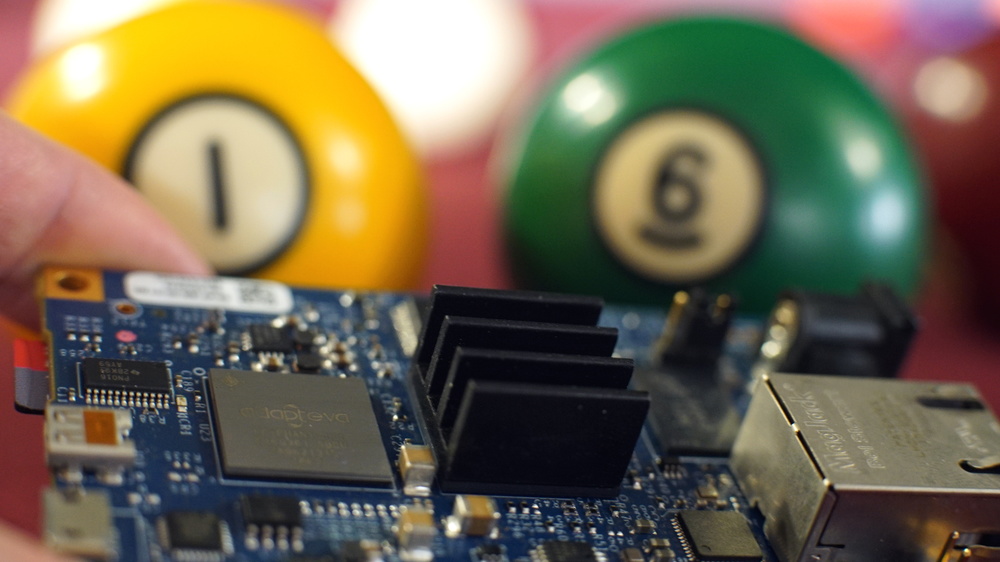
Photo: Julien Desfossez
To demonstrate the potential of barectf 2, I created a barectf platform for the Parallella system, as well as a simple example using it. If you don't own a Parallella board yourself, you may always try the linux-fs-simple example, which will work on any Linux system.
The barectf Parallella platform is made of two parts:
- A consumer application, on the host (ARM) side, which creates a named shared memory region holding 16 ring buffers of packets (one ring buffer per Epiphany core). The consumer periodically checks the producers' positions, consumes packets if they are available, and appends them to stream files on the file system.
- The actual platform code, on the Epiphany side, which attaches to the named shared memory region, and initializes a barectf context with callback functions that will put the closed packets in core-specific ring buffers, provided there's space available (or discard events otherwise).
Building
First, build the consumer application:
git clone https://github.com/efficios/barectf
cd barectf/platforms/parallella/consumer
make
Then, once barectf 2 is installed, build the example:
cd ../../../doc/examples/parallella
make
Of course, you need both the Epiphany and ARM toolchains; the easiest way to build this example is by using the Parallella system itself.
Running
Once everything is built, you will find the generated CTF metadata file
in the ctf directory. You may now start the consumer application,
which will initialize the shared memory region and start checking for
closed packets in the ring buffers:
e-reset
../../../platforms/parallella/consumer/consumer -v
e-reset ensures that the Epiphany cores are stopped before running
the consumer.
Then, load the example program on all 16 Epiphany cores:
e-loader --start parallella.srec 0 0 4 4
This will also start all 16 cores. The example contains a synchronization point where all 16 cores will meet before continuing; this is used to synchronize all the local clocks—more or less, since this synchronization signal transits through the mesh network, and each hop is known to take 1.5 cycles. You will immediately notice the consumer application printing informations about the shared ring buffers as it consumes packets from them.
Once you've had enough, just kill the consumer application (Ctrl+C); it will finish writing any packet currently being written and quit.
Your complete CTF trace is in the ctf directory.
Viewing
You may install Babeltrace directly on the Parallella system:
sudo apt-get install babeltrace
Then, have a look at the recorded (and lost) events:
babeltrace ctf
About the Platform
Remember how the Epiphany architecture is built?
Here's a reminder:
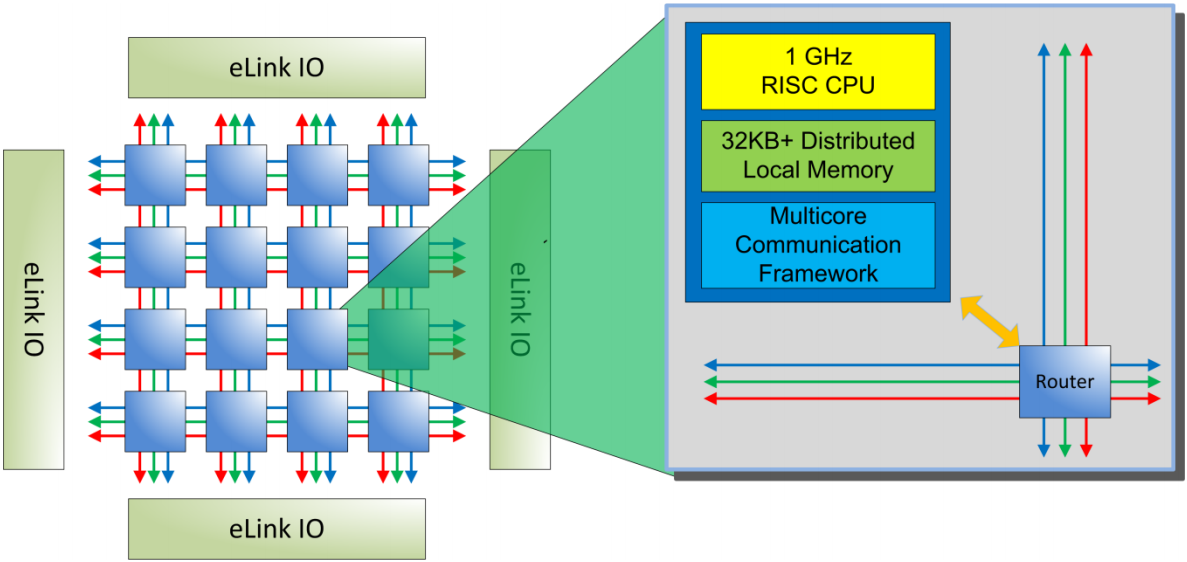
Adapteva E16G301 architecture (Adapteva E16G301 datasheet)
Everytime a core (a node's CPU) needs to read from or write to another core's local memory, the read/write transaction jumps from one neighbor node to the other through the mesh network. Each leap takes 1.5 cycles (1.5 ns at 1 GHz). Transactions also occur through this mesh network for external I/O accesses thanks to one of the four eLink IO bridges shown on the diagram above.
On the Parallella board, one of the eLink IO bridges is connected to a Xilinx FPGA device (a Zynq Z-7020, in my case), which allows both the ARM side (embedded in the Z-7020) and the Epiphany cores to access a shared memory area.
The barectf Parallella platform implements a ring buffer of CTF packets
in this shared memory. Since the Epiphany mesh network can become quite
congested at times, depending on the application, and since we don't
want to add to this congestion, the ring buffer's producer index is not
checked on each tracing function call when the ring buffer is known
to be full.
Instead, a minimum amount of time must be elasped between two checks
in shared memory to lessen the congestion. In the meantime, events are
discarded. This is an application specific trade-off which can be
fine-tuned by a #define in one of the platform's header files.
It should also be noted that Epiphany is a 32-bit architecture and that the 16-core E16G301 device on the Parallella board has no 64-bit cycle counter, nor any 32-bit free-running counter for that matter (the 64-core E64G401 device seems to include one, however). The barectf Parallella platform uses a 32-bit cycle counter which triggers an interrupt handler when it reaches 0 (note that it is a descending counter); the interrupt routine resets the counter to its maximum value and restarts it. In doing so, a drift of a few cycles is accumulated every 4-ish seconds, at 1 GHz. A trivial improvement would be to manually count the number of cycles needed by this interrupt routine and reset the counter to a smaller value. But even then, this interrupt handler could also be interrupted by an interrupt request of an higher priority.
There are many ways to record the timestamp of an event. LTTng, for instance, uses a 27-bit integer when it's convinced that this value wrapped at most once; otherwise, it uses a full 64-bit value. Another classic method is to ensure that at least one event is recorded between each counter wrap to keep track of the wrap count. In the case of the Parallella platform, I chose to use a full 64-bit timestamp for each event to avoid having to record events from an interrupt handler, which would require disabling the counter overflow interrupts during each tracing function call.
Finally, you should know that there's no mechanism, at least on my version of the Parallella board, for an Epiphany core to interrupt the ARM host. Thus, the consumer application polls the producer index of all 16 Epiphany cores every 10 ms.
The Curious Case of the Epiphany
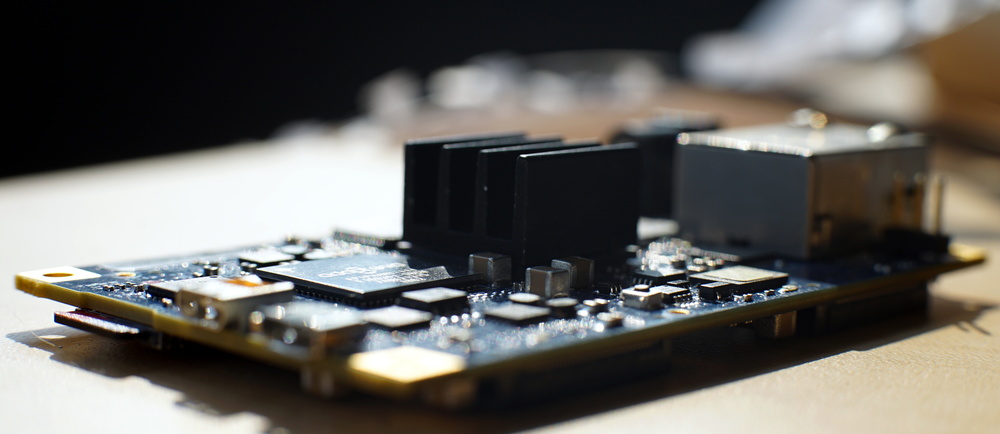
Photo: Julien Desfossez
By the way, I ran into some serious bug while developing this platform. To make a long story short, I had the ring buffer's producer index in shared memory that got incremented by an Epiphany core (the only processor writing to this memory location), yet its unincremented value was read by the same core a few cycles later.
As a programmer, you really need a strong ability to go beyond your comfort zone to put forward the hypothesis that your memory accesses, same thread same address, might be unordered. Fortunately for me, when it comes to such weird situations, Mathieu is always willing to cancel a candle lit dinner to break the back of the beast.
Look at the diagram above again. Each green mesh is where external write transactions travel, whereas each red mesh is where read transactions travel. Yes: they use different paths. When doing something as rudimentary as:
/* send a write transaction */
my_structure_in_shared_memory->index = new_value;

/* send a read transaction */
do_something_with(my_structure_in_shared_memory->index);
there are some chances, depending on your mesh network congestion, that
the first line's write operation will not be completed when the
second line's read access retrieves the value. In this case,
do_something_with() would be called with the old value of
my_structure_in_shared_memory->index. This is particularly true when
there are many write accesses, but only a few read accesses going on
over the network, which is somewhat the exact case of my test
program: complete CTF packets are copied from local memory areas to the
shared memory, and almost nothing is read back.
Adve and Gharachorloo wrote Shared Memory Consistency Models: A Tutorial, an interesting article on the subject:
Most high-level uniprocessor languages present simple sequential semantics for memory operations. These semantics allow the programmer to assume that all memory operations will occur one at a time in the sequential order specified by the program (i.e., program order). Thus, the programmer expects a read will return the value of the last write to the same location before it by the sequential program order.
If you're interested in this kind of business, I wrote a small demo which reproduces the problem.
The main issue here is that, even though the Epiphany Architecture Reference document (as of this date) states that Epiphany's memory model is a weakly ordered one, it's actually much weaker than that. It is even weaker than local consistency, which is the weakest kind of shared memory consistency model, when a core reads from/writes to anything outside its local memory region. From Wikipedia:
In Local consistency, each process performs its own operations in the order defined by its program. There is no constraint on the ordering in which the write operations of other processes appear to be performed. Local consistency is the weakest consistency model in shared memory systems.
Adapteva's founder Andreas Olofsson actually wrote a Parallella forum post on the topic a year ago. From this post:
It's very unusual for a shared memory architecture to not obey [read after write] ordering so this has given more than one seasoned programmer serious headaches.
I can confirm that it did.
There are many ways to solve this. Here's a quick and dirty one:
/* send a write transaction */
my_structure_in_shared_memory->index = new_value;

/* I understand it might not be a natural reflex to do this: */
while (my_structure_in_shared_memory->index != new_value);

/* send a read transaction; safe now */
do_something_with(my_structure_in_shared_memory->index);
Note that this behavior is not exhibited with local memory accesses; Adapteva confirmed to me that strict memory ordering is enforced for program reading from/writing to the 32 kiB of local memory (addresses 0 to 0x7fff).
Since we know that local memory accesses obey strict memory ordering, the approach chosen in the barectf platform is to keep the shadow of the producer index in the core's local memory and to update it when its counterpart in shared memory is also updated. Then, only the producer index's shadow is read throughout the whole source code. The producer index in shared memory is therefore only used by the consumer application:
/* send a write transaction and update local shadow accordingly */
my_structure_in_shared_memory->index = new_value;
my_structure_in_local_memory->index = new_value;

/* read local shadow (always safe) */
do_something_with(my_structure_in_local_memory->index);
What's Next?
Bare-metal tracing is a fascinating domain because you always need to deal with tight constraints as well as unusual behaviors.
In all honesty, I would have prefered releasing barectf 2 with support for all CTF types. As of now, barectf is limited to basic CTF types: integers, floating point numbers, enumerations, and null-terminated strings. But I still need to find a clever way to separate tracing function arguments from event fields, and for the user to provide its own serialization functions. The YAML configuration format is certainly going to help for this.
There are a few optimizations that could still be done on the generated C code side. For example, some explicit aligning code could be removed when the current packet position is known at generation time.
Regarding the barectf Parallella platform, I would be interested in taking a few measurements to see if, for example, amortizing the shared memory accesses when the ring buffer is full is as beneficial as I think it is. Also, the ring buffer parameters (packet size, number of packets per ring buffer, back-end check timeout, etc.) could be dynamically set by the consumer application and read by the platform instead of statically defining them in a common C header file.
barectf is an open source project
written in Python 3 (with some
templates of C). Should you have any issue or feature request, feel free
to
create a new GitHub issue.
Better yet, if you want to pitch in,
create a new pull request.
I'm also available on LTTng's IRC channel
(#lttng on the OFTC network) as eepp.
In the meantime, happy bare-metal tracing!